Craftpine

This is Corner's store study in full. The short version is on one page, and there is a 60-page PDF.

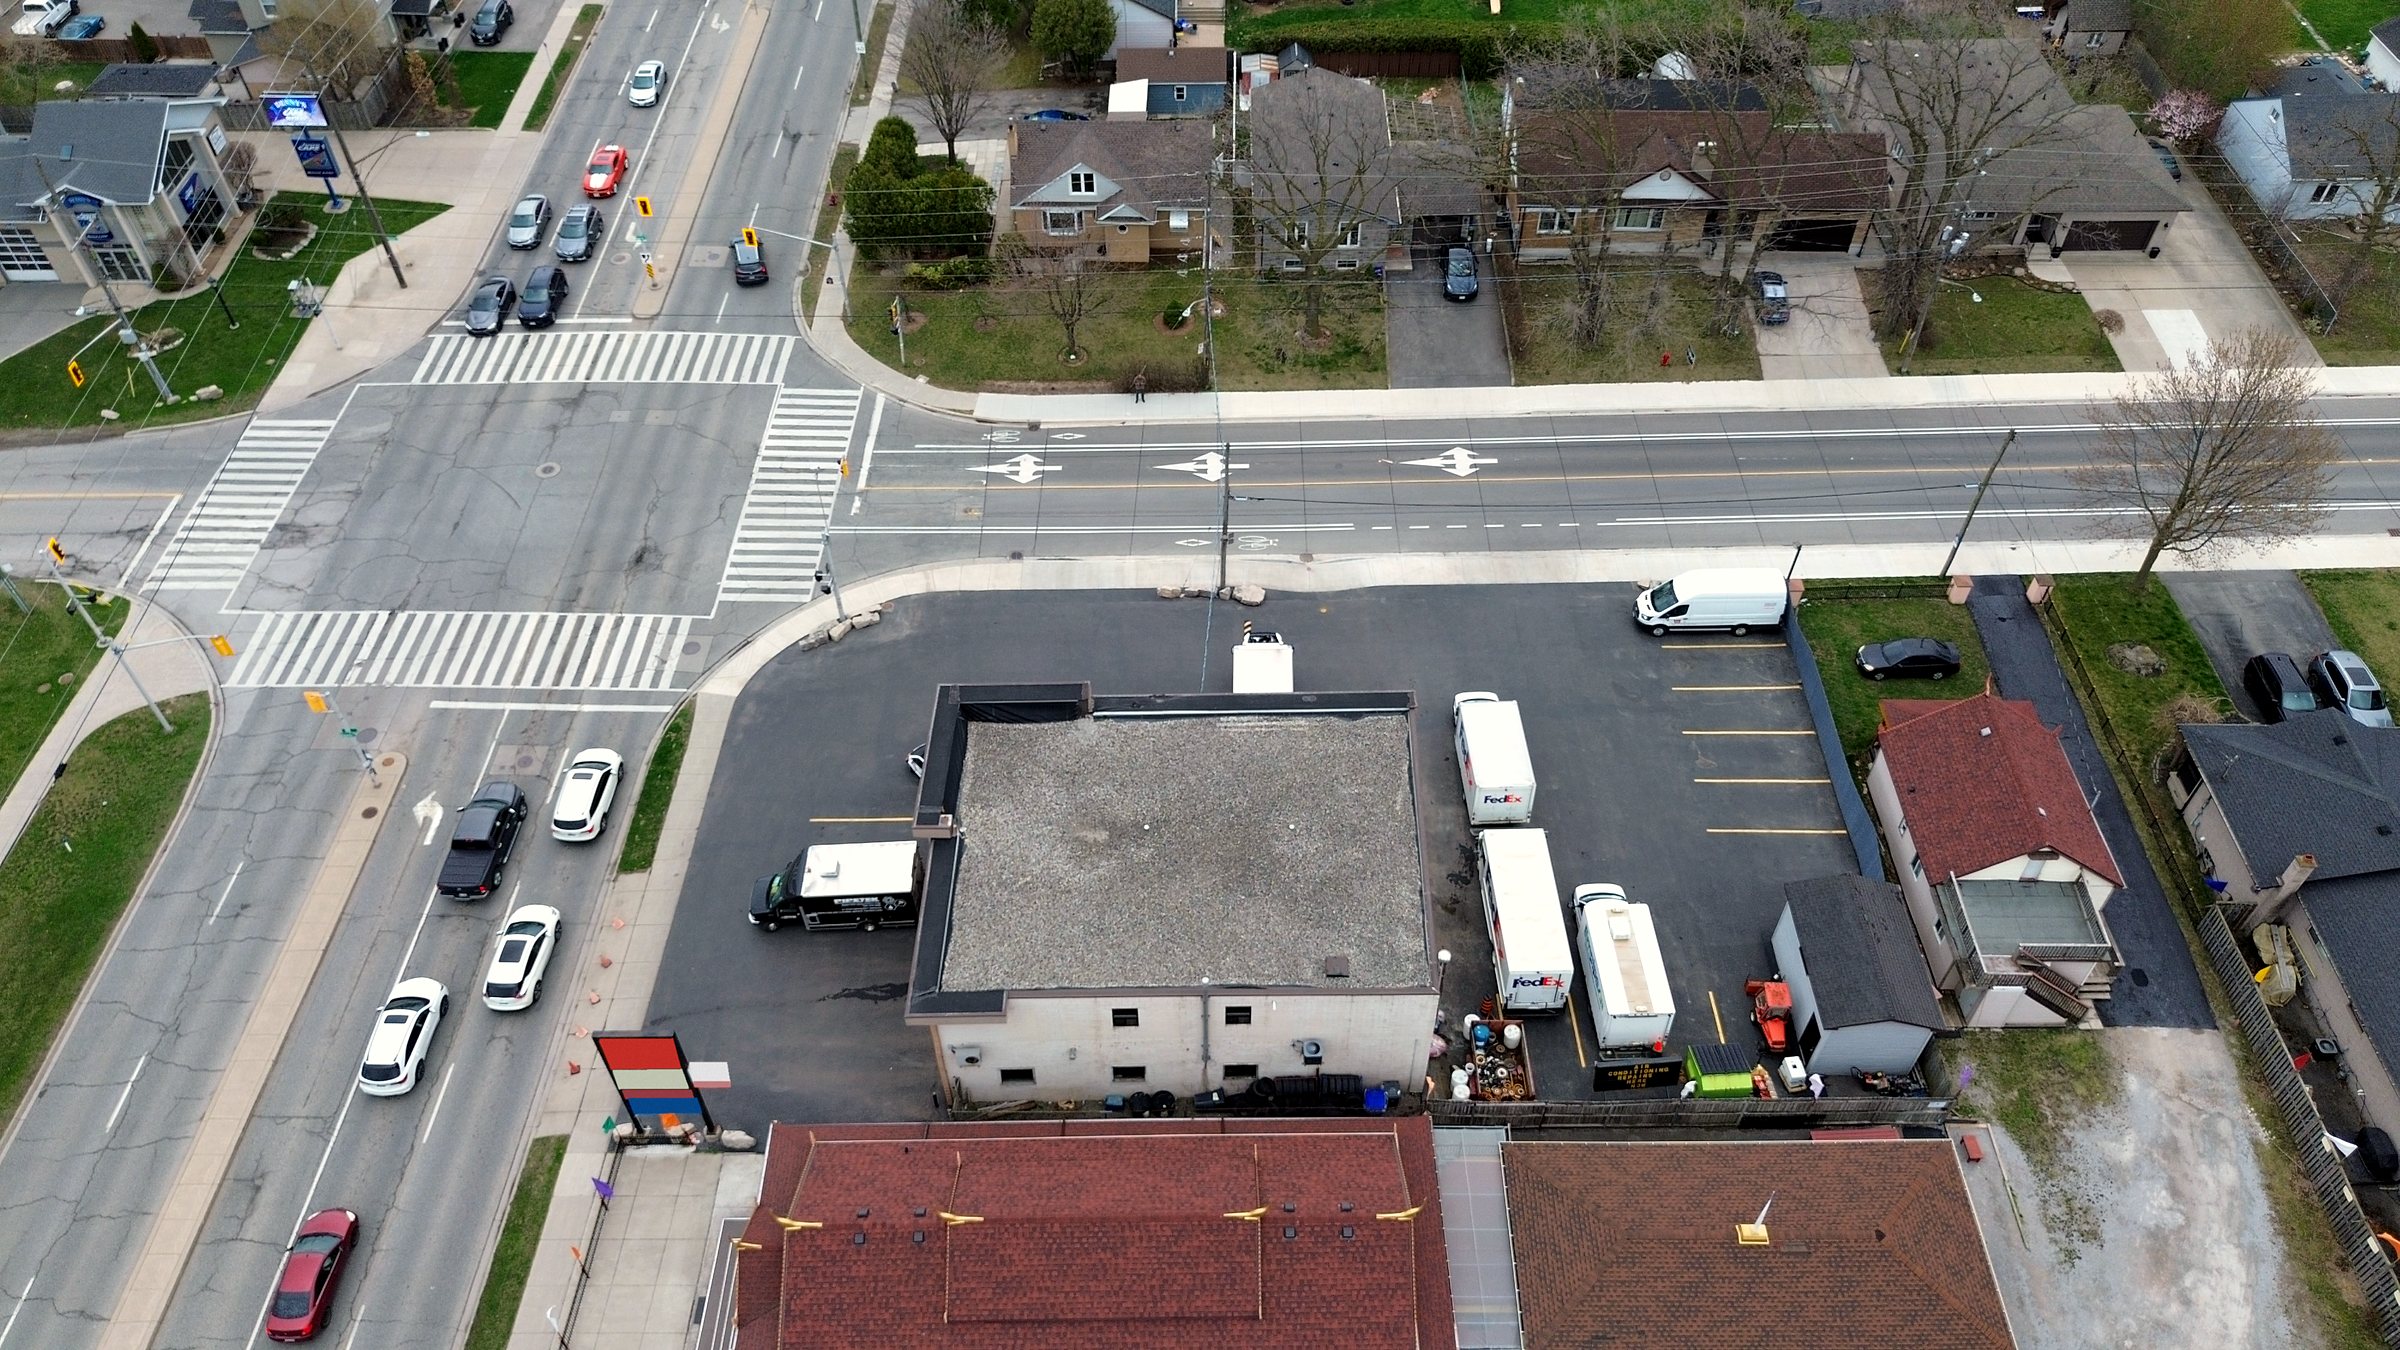
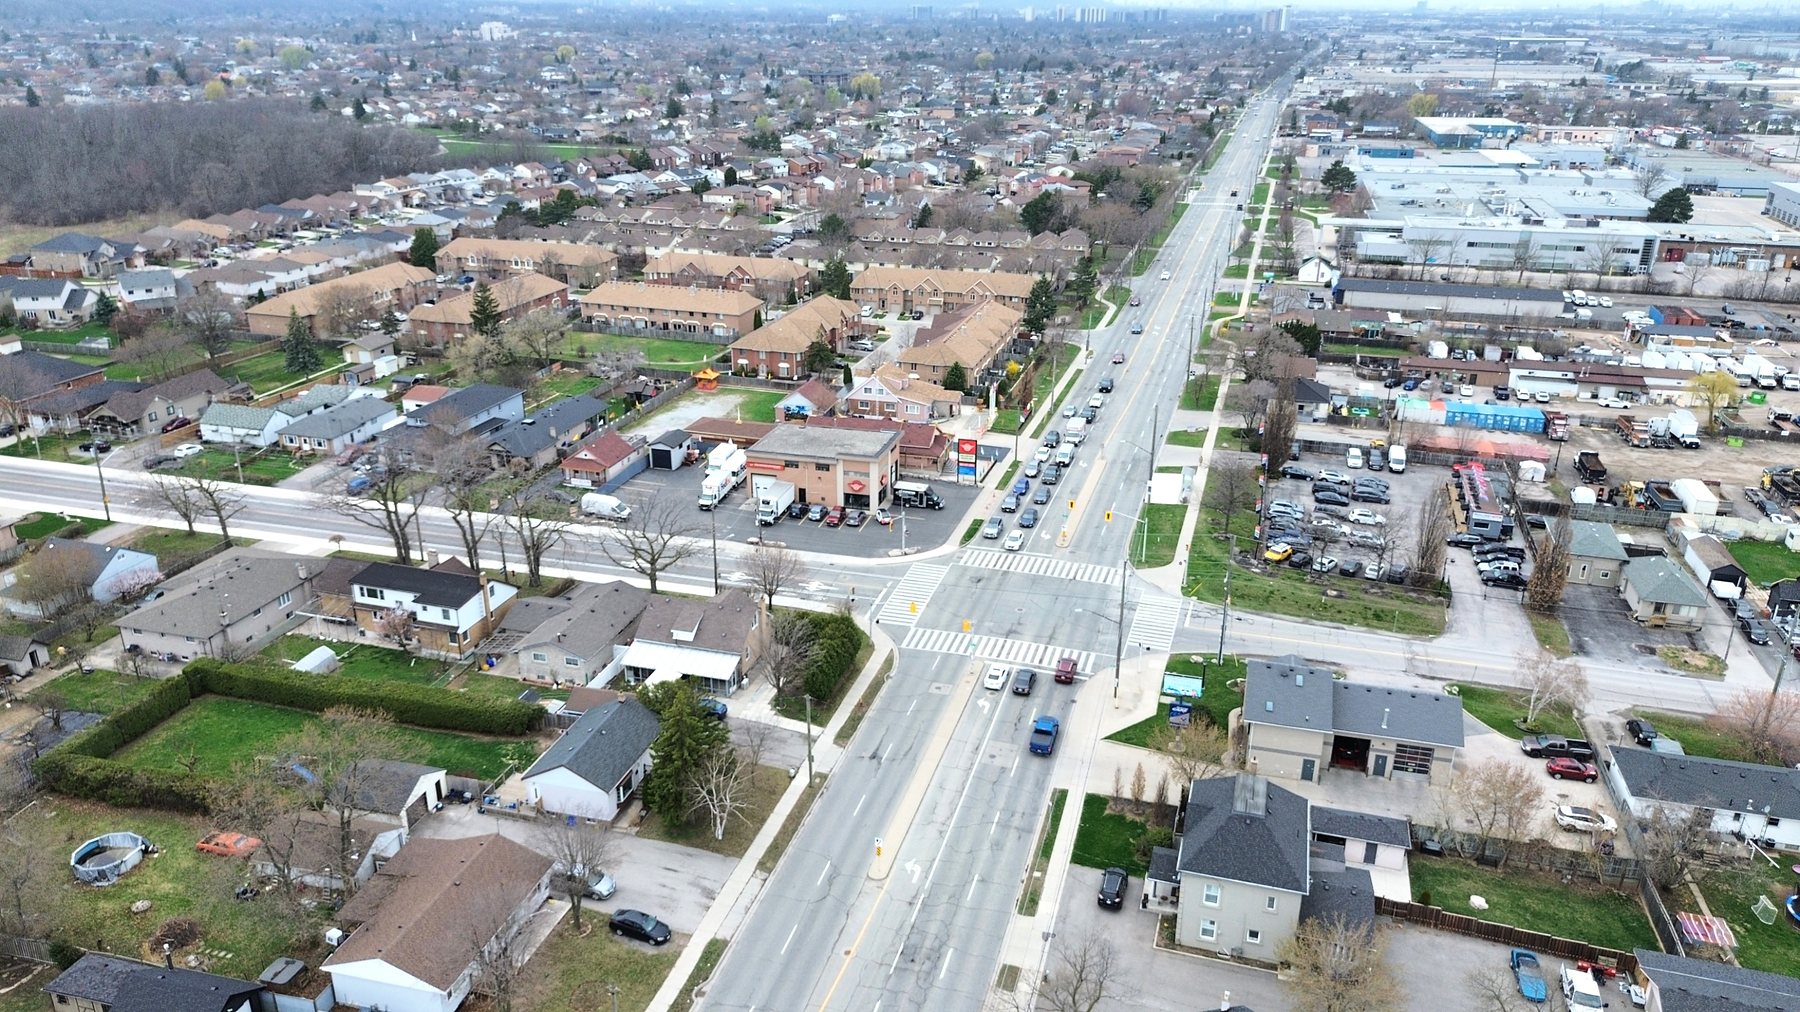
Aerial view of a signalized suburban intersection with a two-storey masonry commercial building on the corner lot, residential streets behind

The study site, from the north-east. The corner of Barton Street East and Dewitt Road, April 2025. Site photography, the study’s own archive.

Craftpine · Corner · Study

520 Barton

An unattended-retail feasibility study.

A corner property in Stoney Creek, Hamilton, and the venue question inside Corner, a 76-day program: can unattended, machine-served retail carry itself with no staff, in a small structure on a high-exposure lot?

Craftpine · TorontoJuly 2026 · This edition October 2026

Abstract

This study examines 520 Barton Street East as a site for unattended, machine-served retail. It covers the site’s exposure and zoning, the concepts considered, the unattended fresh-drink category’s public evidence base, the regulatory classification question in two jurisdictions, a buy-or-build assessment of drink automation, the Corner software platform built alongside, and the unit economics at total capital.

The method was kill criteria set before spend. The verdict is kill: unattended fresh-drink retail fails on demand per machine in every measured case, and the cost of proving otherwise exceeds the return available, as better-funded operators established before this program began. The corner remains a strong asset. Venue capital spent was approximately zero.

Findings, by chapter

  1. 01The asset is the corner; everything else in this study tests what it can carry.
  2. 02Eight concepts entered the funnel and none survived. Every one carried a kill criterion written before capital.
  3. 03The unattended fresh-drink category has exactly one measured throughput figure in its public record; this chapter is built around it.
  4. 04On paper, an unattended fresh-drink kiosk in Ontario needs a trained human standing next to it. In practice, two cities’ own open data show the paper is not how the category is policed.
  5. 05The machine question entered the study as a prediction: a doctrine-compliant drink robot exists at or under $20,000 CAD landed. The research falsified it.
  6. 06While the retail question was being researched, the software it would need was built by one founder over 76 days and tested to destruction.
  7. 07The zero-labour drink store clears its running costs at four cups a day. The problem is paying back the capital, at demand anyone has measured.
  8. 08A walking customer cannot reach the rear structure without crossing the lot’s vehicle circulation. That caps what the building can hold. It is the narrowest finding in this study, a bound on one 240 square foot structure, and it is not the reason the program closed.
  9. 09Unattended fresh-drink retail fails on demand per machine everywhere it has been measured, and the cost of proving otherwise exceeds the return available. Several far better-funded operators established that before this program began.
Disclosure: the study site is held by an entity related to the studio’s founder. The work was self-funded research, not a client engagement.

Craftpine Inc. · Toronto, Ontario · hello@craftpine.com · craftpine.com

First published in July 2026. This edition, October 2026.

Set in Source Serif 4 and Inter. Drawings and maps are drawn for this study; map data © OpenStreetMap contributors (ODbL) and Natural Earth (public domain). Every picture is credited under it and again in the picture credits at the back.

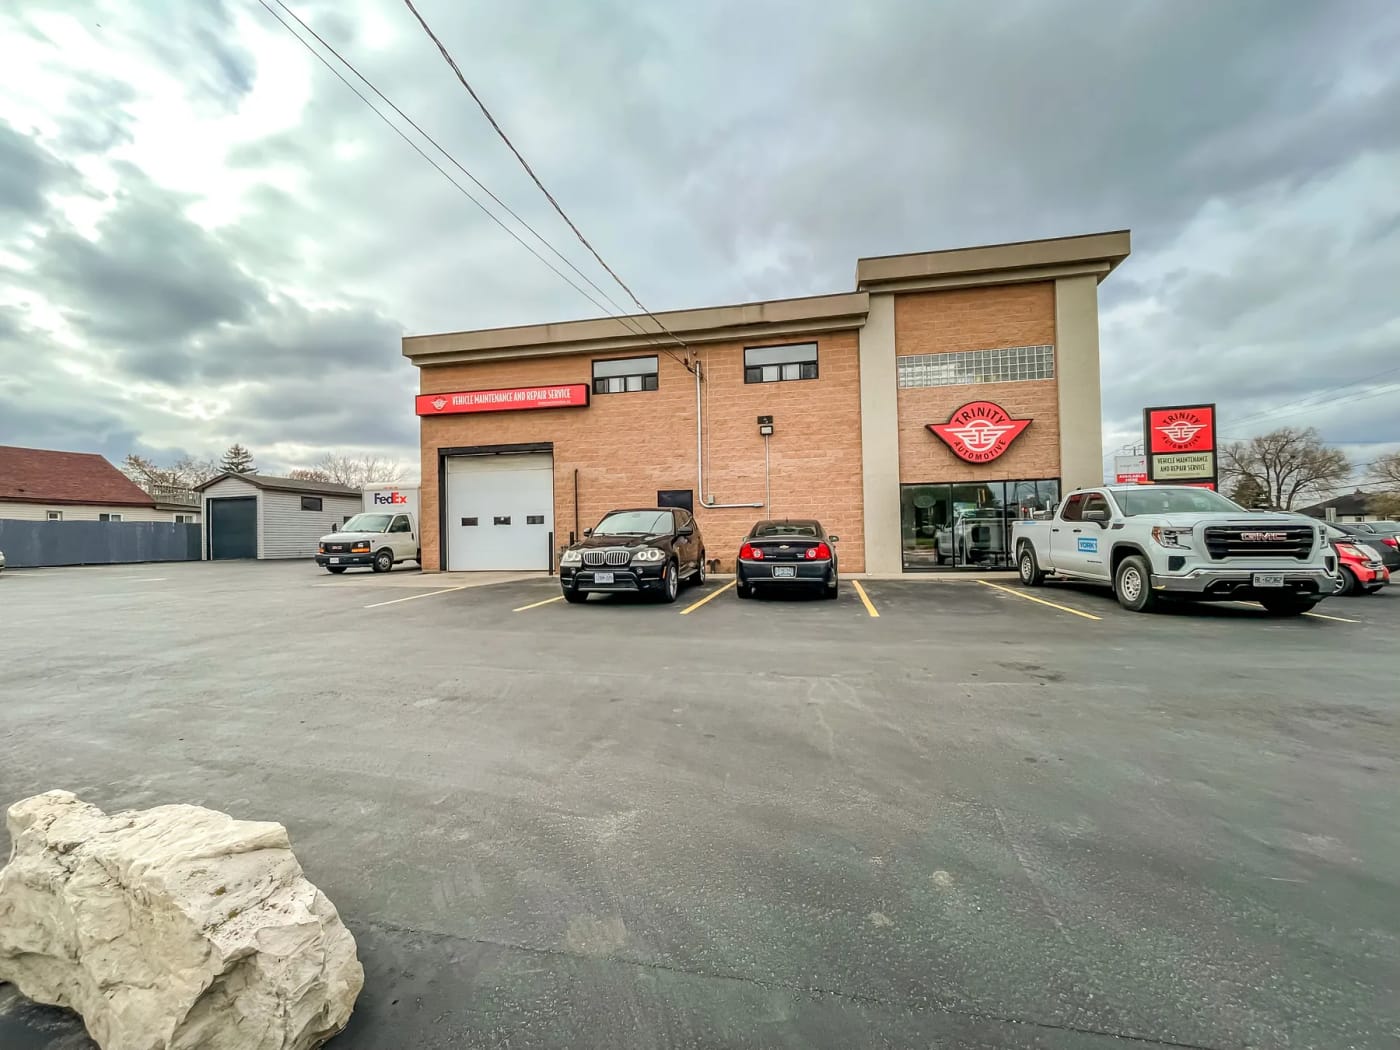
Low aerial view of No. 520 from the north, its two service bays facing Barton Street East, the junction to the left

Chapter 01

The site

The asset is the corner; everything else in this study tests what it can carry.

In this chapter

  1. 1.1Exposure
  2. 1.2Context

At a glance

90 × 160 ft
the lot, with frontage on both streets
21,000+
vehicles a day at the junction, as listed
5,364 sq ft
the building, two storeys, built 1947

No. 520 from the north, its twin bays facing Barton Street East, April 2025. Site photography, the study’s own archive.

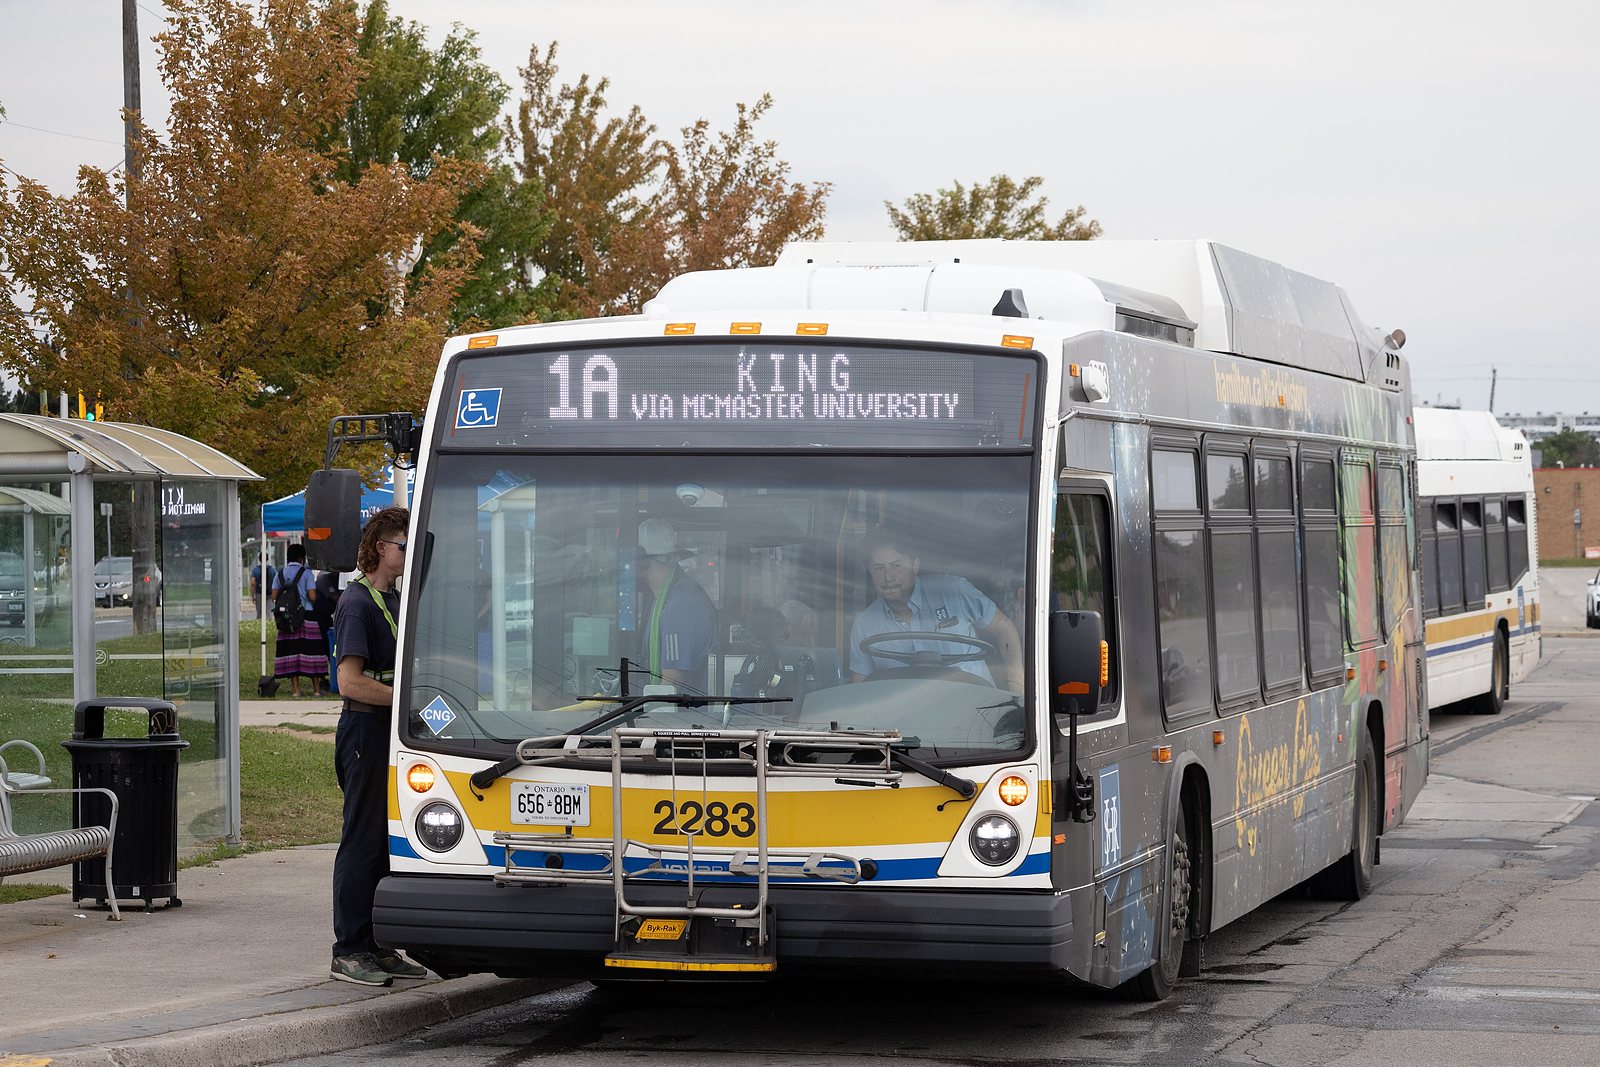
A yellow and white Hamilton Street Railway bus on route 1A King at a suburban terminal
Figure 1.1A Hamilton Street Railway bus on route 1A at Eastgate Square, Stoney Creek, September 2026. Five HSR routes run the Barton corridor (section 1.1).Photo: BrackishStowaway, CC BY 4.0, via Wikimedia Commons.

520 Barton Street East sits at the signalized junction of Barton Street East and Dewitt Road in Stoney Creek, Hamilton. The lot is 90 by 160 feet, with frontage on both streets. The building is 5,364 square feet over two storeys, built 1947, steel and masonry, with three service bays and five hoists.1 The current tenant is Mr. Lube + Tires, active and in good standing.1

Zoning is C2, Neighbourhood Commercial. Permitted uses include motor vehicle service, restaurant, medical clinic, financial establishment, and veterinary practice.1 The zoning is part of why the parcel matters: the permitted-use list is wide enough to leave the site’s use open.

Stoney Creek, on the QEW at the west end of Lake Ontario.
LAKE ONTARIOUNITEDSTATESCANADATorontoMississaugaOakvilleBurlingtonHamiltonGrimsbySt. CatharinesNiagara FallsQEWQEW403407405406520 BartonStoney CreekN01020 km
Figure 1.2The site in its region. The Queen Elizabeth Way follows the lake from Toronto through Hamilton toward Niagara; the property’s management site gives the QEW as two kilometres away, via Fruitland Road. Approximate scale.Base map: Natural Earth, public domain. Drawn for this study.
One corner, two frontages: the exposure geometry.
Barton St EDewitt RdparkingNo. 520: two storeys, three service baysNo. 5203 baysRear structure, 12 by 20 feetrear structurelot 90 × 160 ft90 ft160 ftdigital billboard · 521 Bartonfaces east and west, over Barton trafficsignalized intersection · 21,000+ vehicles a day, as listedNHSR routes 1 · 2 · 3 · 4 · 10residential fabric, three sidesQEW 2 km · Red Hill 3 km
Figure 1.3Dual frontage on a signalized junction, with the through-traffic and transit routes that produce it. The building sits against the lot’s west line, long axis north–south, with the parking on the Dewitt side: twin bays on the Barton face, a third at the south end of the east face. The billboard across the intersection faces east and west over Barton’s traffic. Schematic, approximate scale.Geometry: 2007 Ontario Land Surveyor site plan of the parcel (on file); property facts as published at 520barton.com; aerial photography, April 2025 (orientation from the source files’ camera-heading EXIF). Traffic figure as listed; see note 2.

Exposure

The junction carries 21,000 or more vehicles per day, as listed by the property’s commercial listing and its management site.2 Five HSR bus routes run the corridor: 1, 2, 3, 4, and 10.1 The QEW is two kilometres away via Fruitland Road; the Red Hill Valley Parkway is three.1

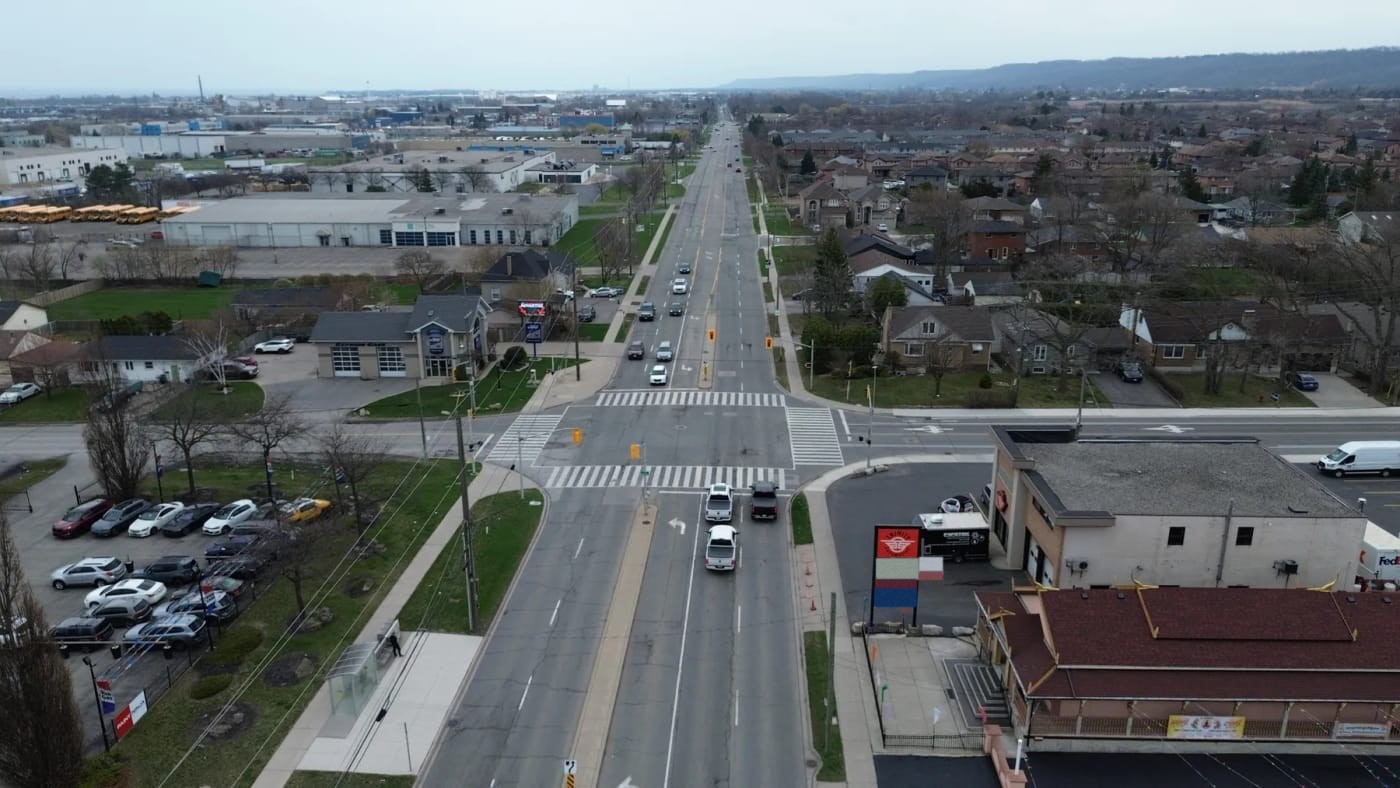
Third parties price this exposure. The digital billboard across the intersection, at 521 Barton, is marketed at 21,034 daily impressions.3 Its two faces point east and west, down the Barton corridor, at exactly the traffic the counts describe.

Low aerial along Barton Street East toward the junction, with the 521 Barton digital billboard over the eastbound lanes and the corner property on the right
Figure 1.4Barton eastbound toward the Dewitt junction, April 2025. The 521 Barton digital board stands beyond the junction at left; the subject corner is at right. The board’s faces point down the corridor, at the same traffic the counts describe.Site photography, the study’s own archive.
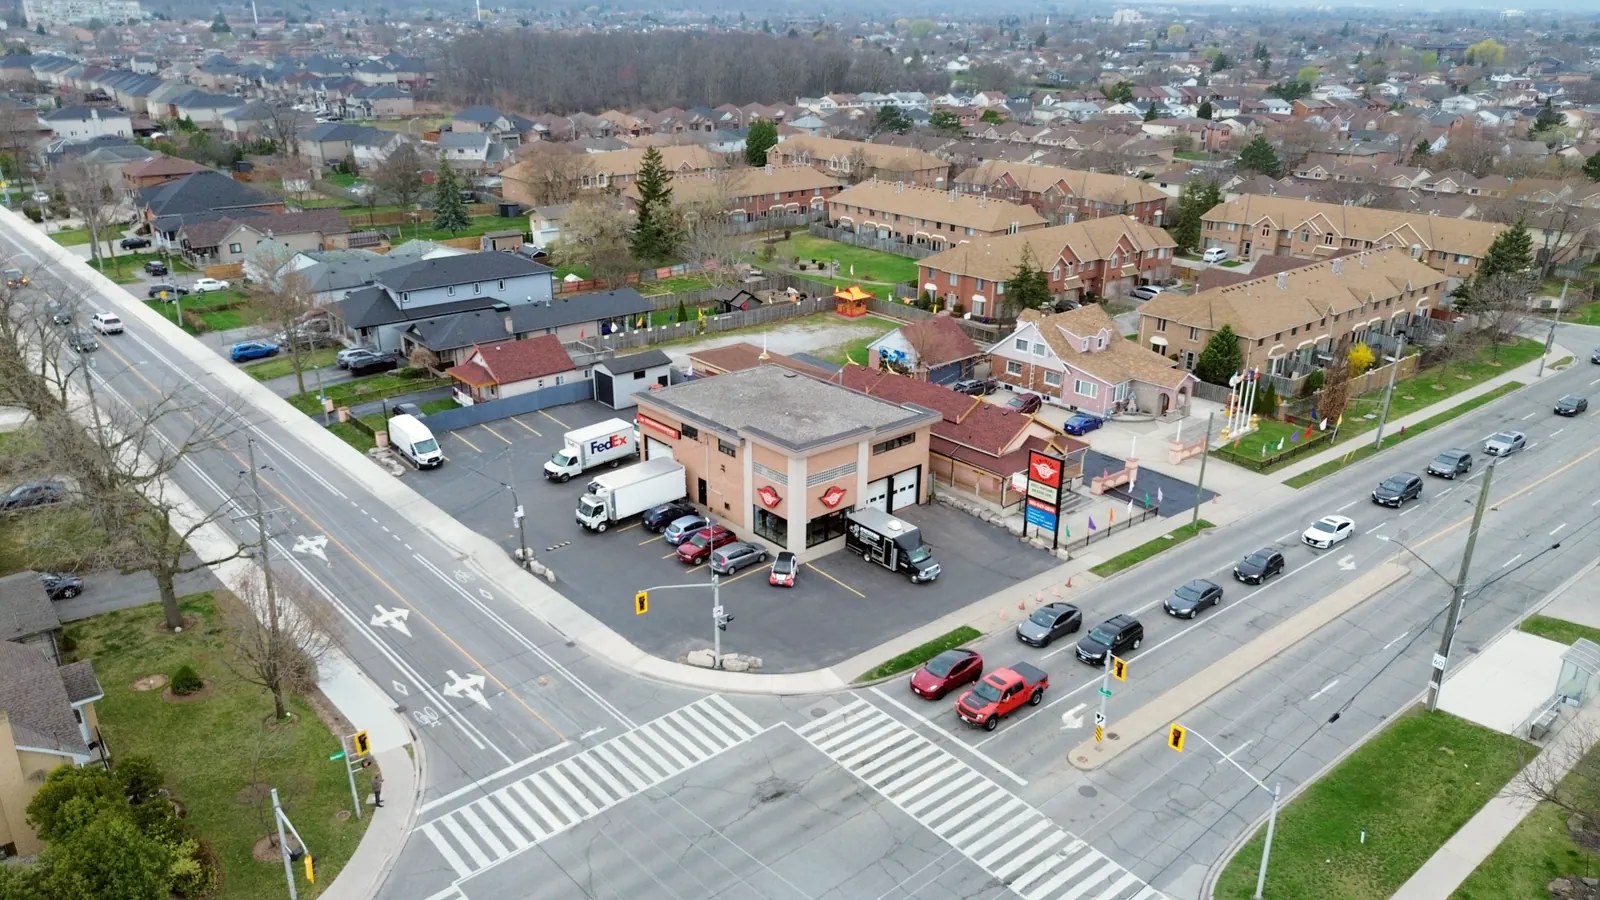
Oblique aerial of the corner property showing a queue of cars at the signal and dense residential streets beyond
Figure 1.5The corner from the north-east, April 2025. Queue on Barton at the signal; townhouse and detached residential fabric on three sides. Signage in the photograph is the prior tenant’s.Site photography, the study’s own archive.

Context

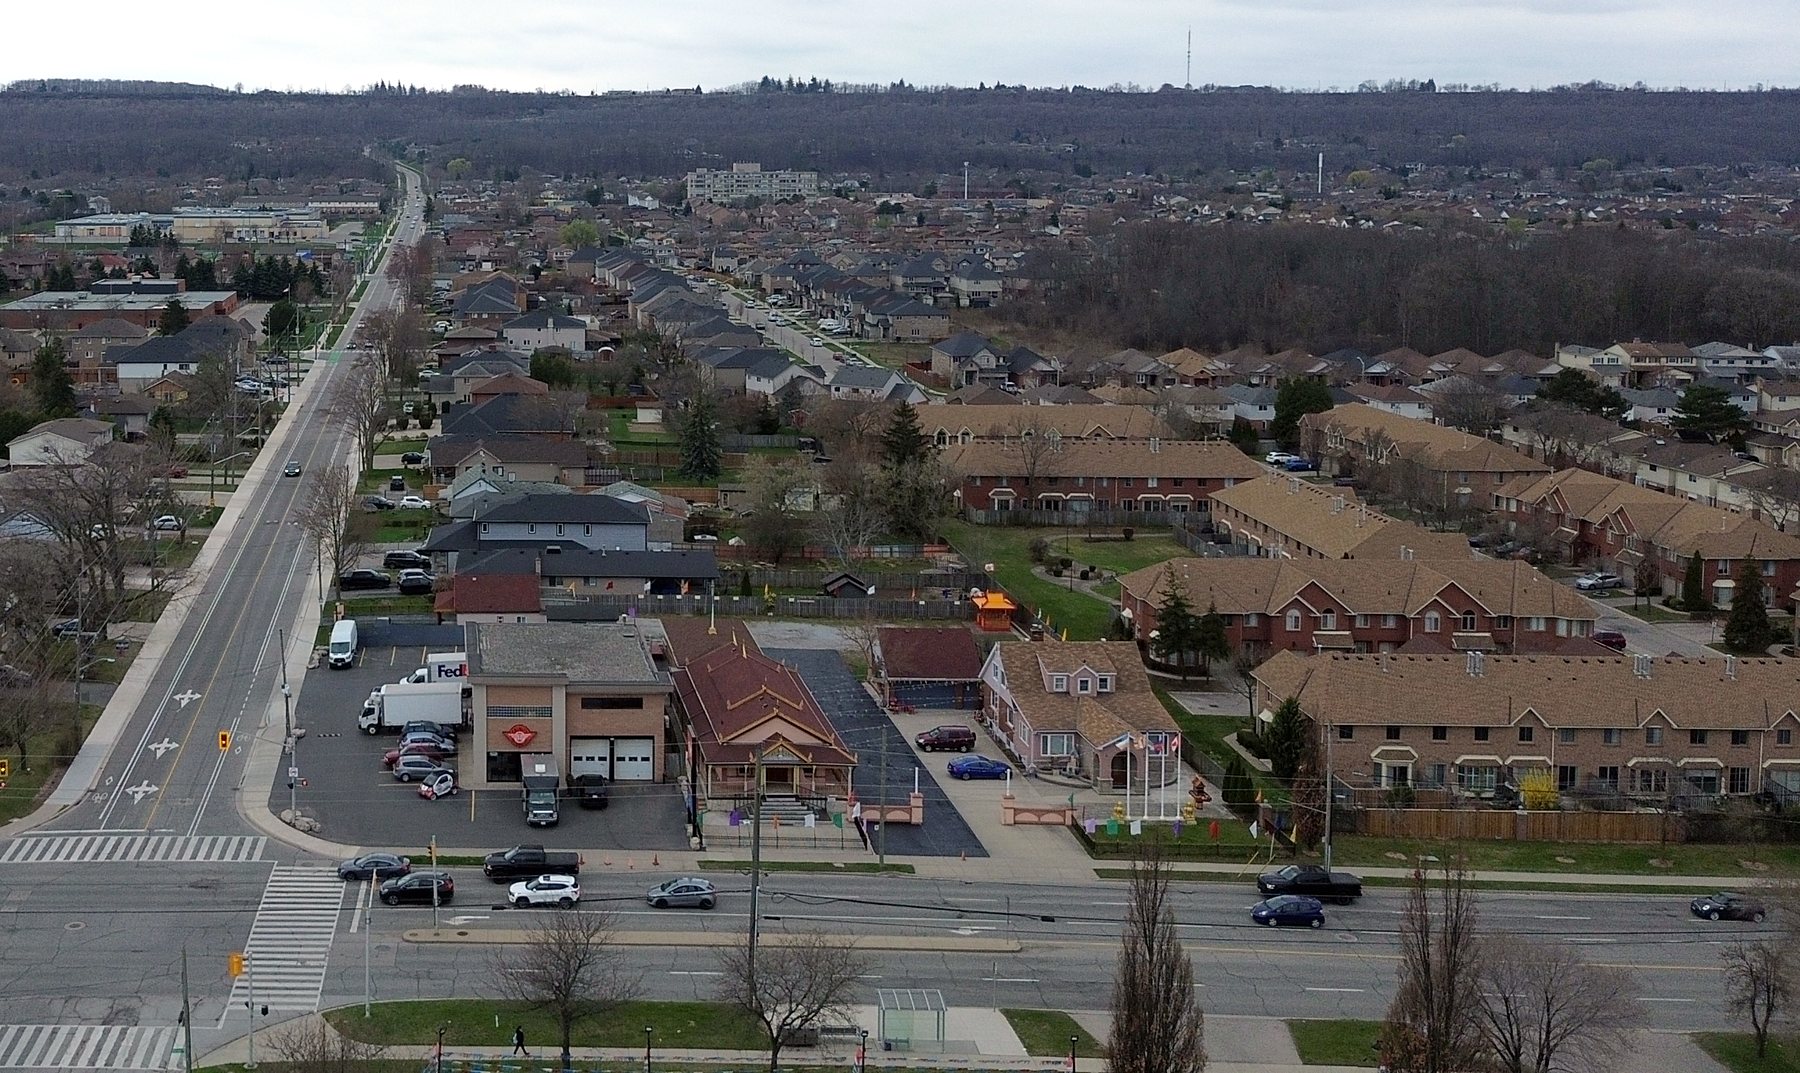
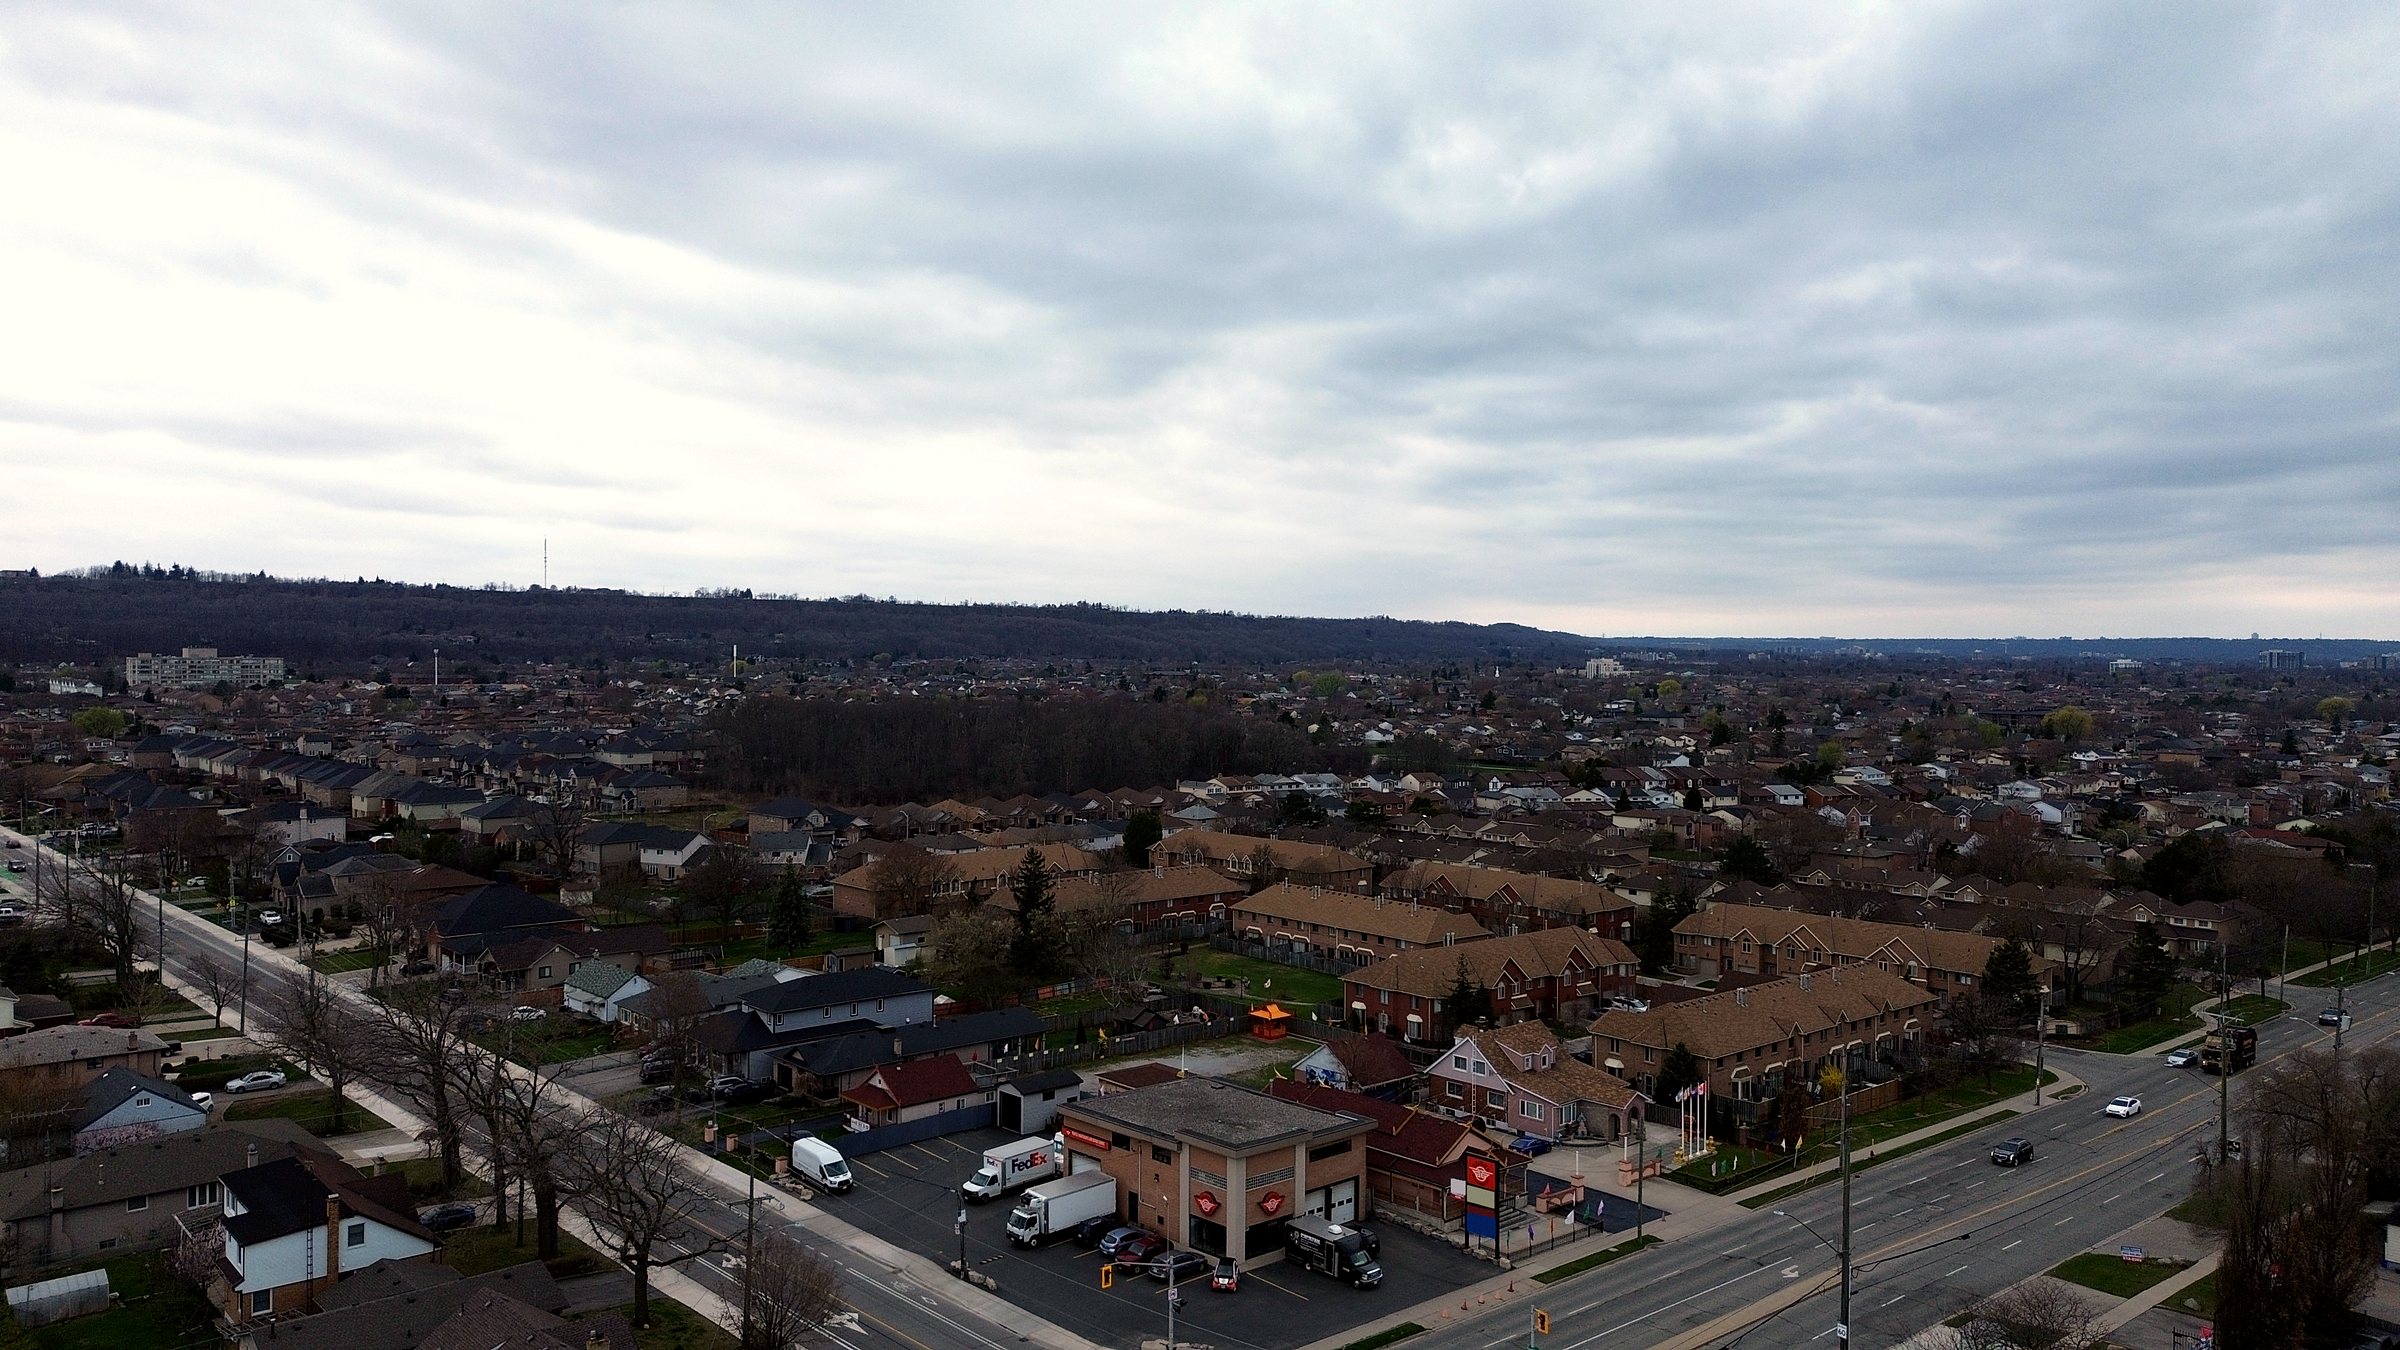
Aerial looking south along Dewitt Road: the corner building and its lot, rows of townhouses to the west, detached houses along the side streets, and the wooded escarpment on the horizon
Figure 1.6The junction from above Barton, looking south along Dewitt Road, April 2025. The corner at left of centre, townhouse blocks to its west, detached houses along Dewitt and the side streets, the escarpment on the horizon. Signage in the photograph is the prior tenant’s.Site photography, the study’s own archive.

The surrounding fabric is residential on three sides: detached houses along Dewitt and the side streets, townhouse blocks to the west, and across Barton to the north an industrial and commercial strip. Two schools sit within walking distance, a secondary school and an elementary school, which matters later in this study when demand is counted by channel rather than assumed.

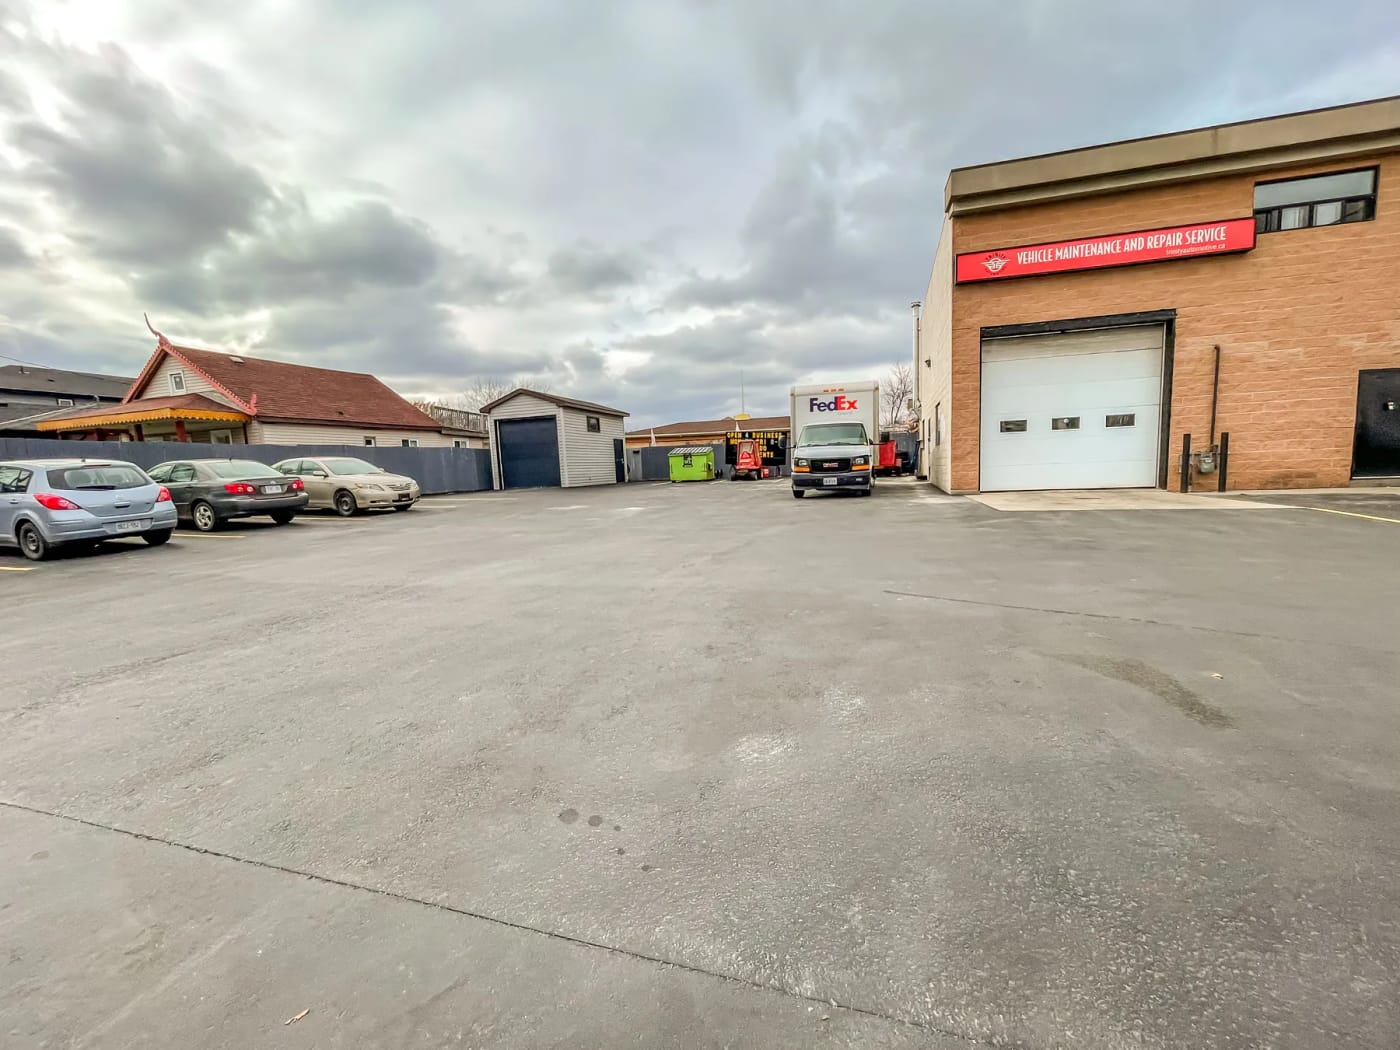
The property’s working life is automotive service, and its street presence reflects that: twin bays on the Barton face, a third at the south end of the east face, a parking apron wrapping the building’s east and south sides, and three curb cuts, one on Barton and two on Dewitt.

The subject of this study is the small structure at the rear of the lot, 12 by 20 feet. The main building is leased; the rear structure and a slice of the lot are not part of the tenant’s premises, which left them free to study.

Within a walk of the corner.
BARTON STREET EASTBARTON ST EDEWITT ROADFRUITLAND ROADHIGHWAY 8MILLEN RD400 m800 mElementary schoolOur Lady of PeaceSecondary schoolOrchard Park520 BartonN0250500 m
Figure 1.7The junction and its neighbourhood, north up. The rings are 400 and 800 metres from the corner as the crow flies, a planner’s five- and ten-minute walk. The elementary school of this chapter’s context sits inside the first, the secondary school on the second. Darker blocks are industrial and commercial land; the lighter fill is housing.Map data © OpenStreetMap contributors, ODbL. Drawn for this study.

Notes

  1. Property facts (lot, building, zoning and permitted uses, transit routes, highway distances, tenancy) as published by the property’s management site, 520barton.com, accessed 2026-07-14 and 2026-07-15.
  2. 21,000+ daily vehicles: as listed on the property’s LoopNet listing (loopnet.ca, listing 35028900) and repeated at 520barton.com. The LoopNet page was not directly fetchable at the 2026-07-15 access attempt (HTTP 403 to automated access); the figure is reported here as listed, not independently measured. A City of Hamilton open-data traffic count for this junction was searched for and not found; no estimate is substituted.
  3. 21,034 daily impressions: the billboard vendor’s listed figure for the 521 Barton Street digital board (Vendo Media). The vendor’s per-board listing page was not directly fetchable at the 2026-07-15 access attempt; the figure is reported as listed by the vendor.
An independent convenience store on a Toronto street, its red Convenience sign over the door

Chapter 02

The concept space

Eight concepts entered the funnel and none survived. Every one carried a kill criterion written before capital.

In this chapter

  1. 2.1What each concept met
  2. 2.2The kill criteria

At a glance

8
concepts entered the funnel
0
survived
7
numbered kill criteria on the fresh-drink format, set before capital

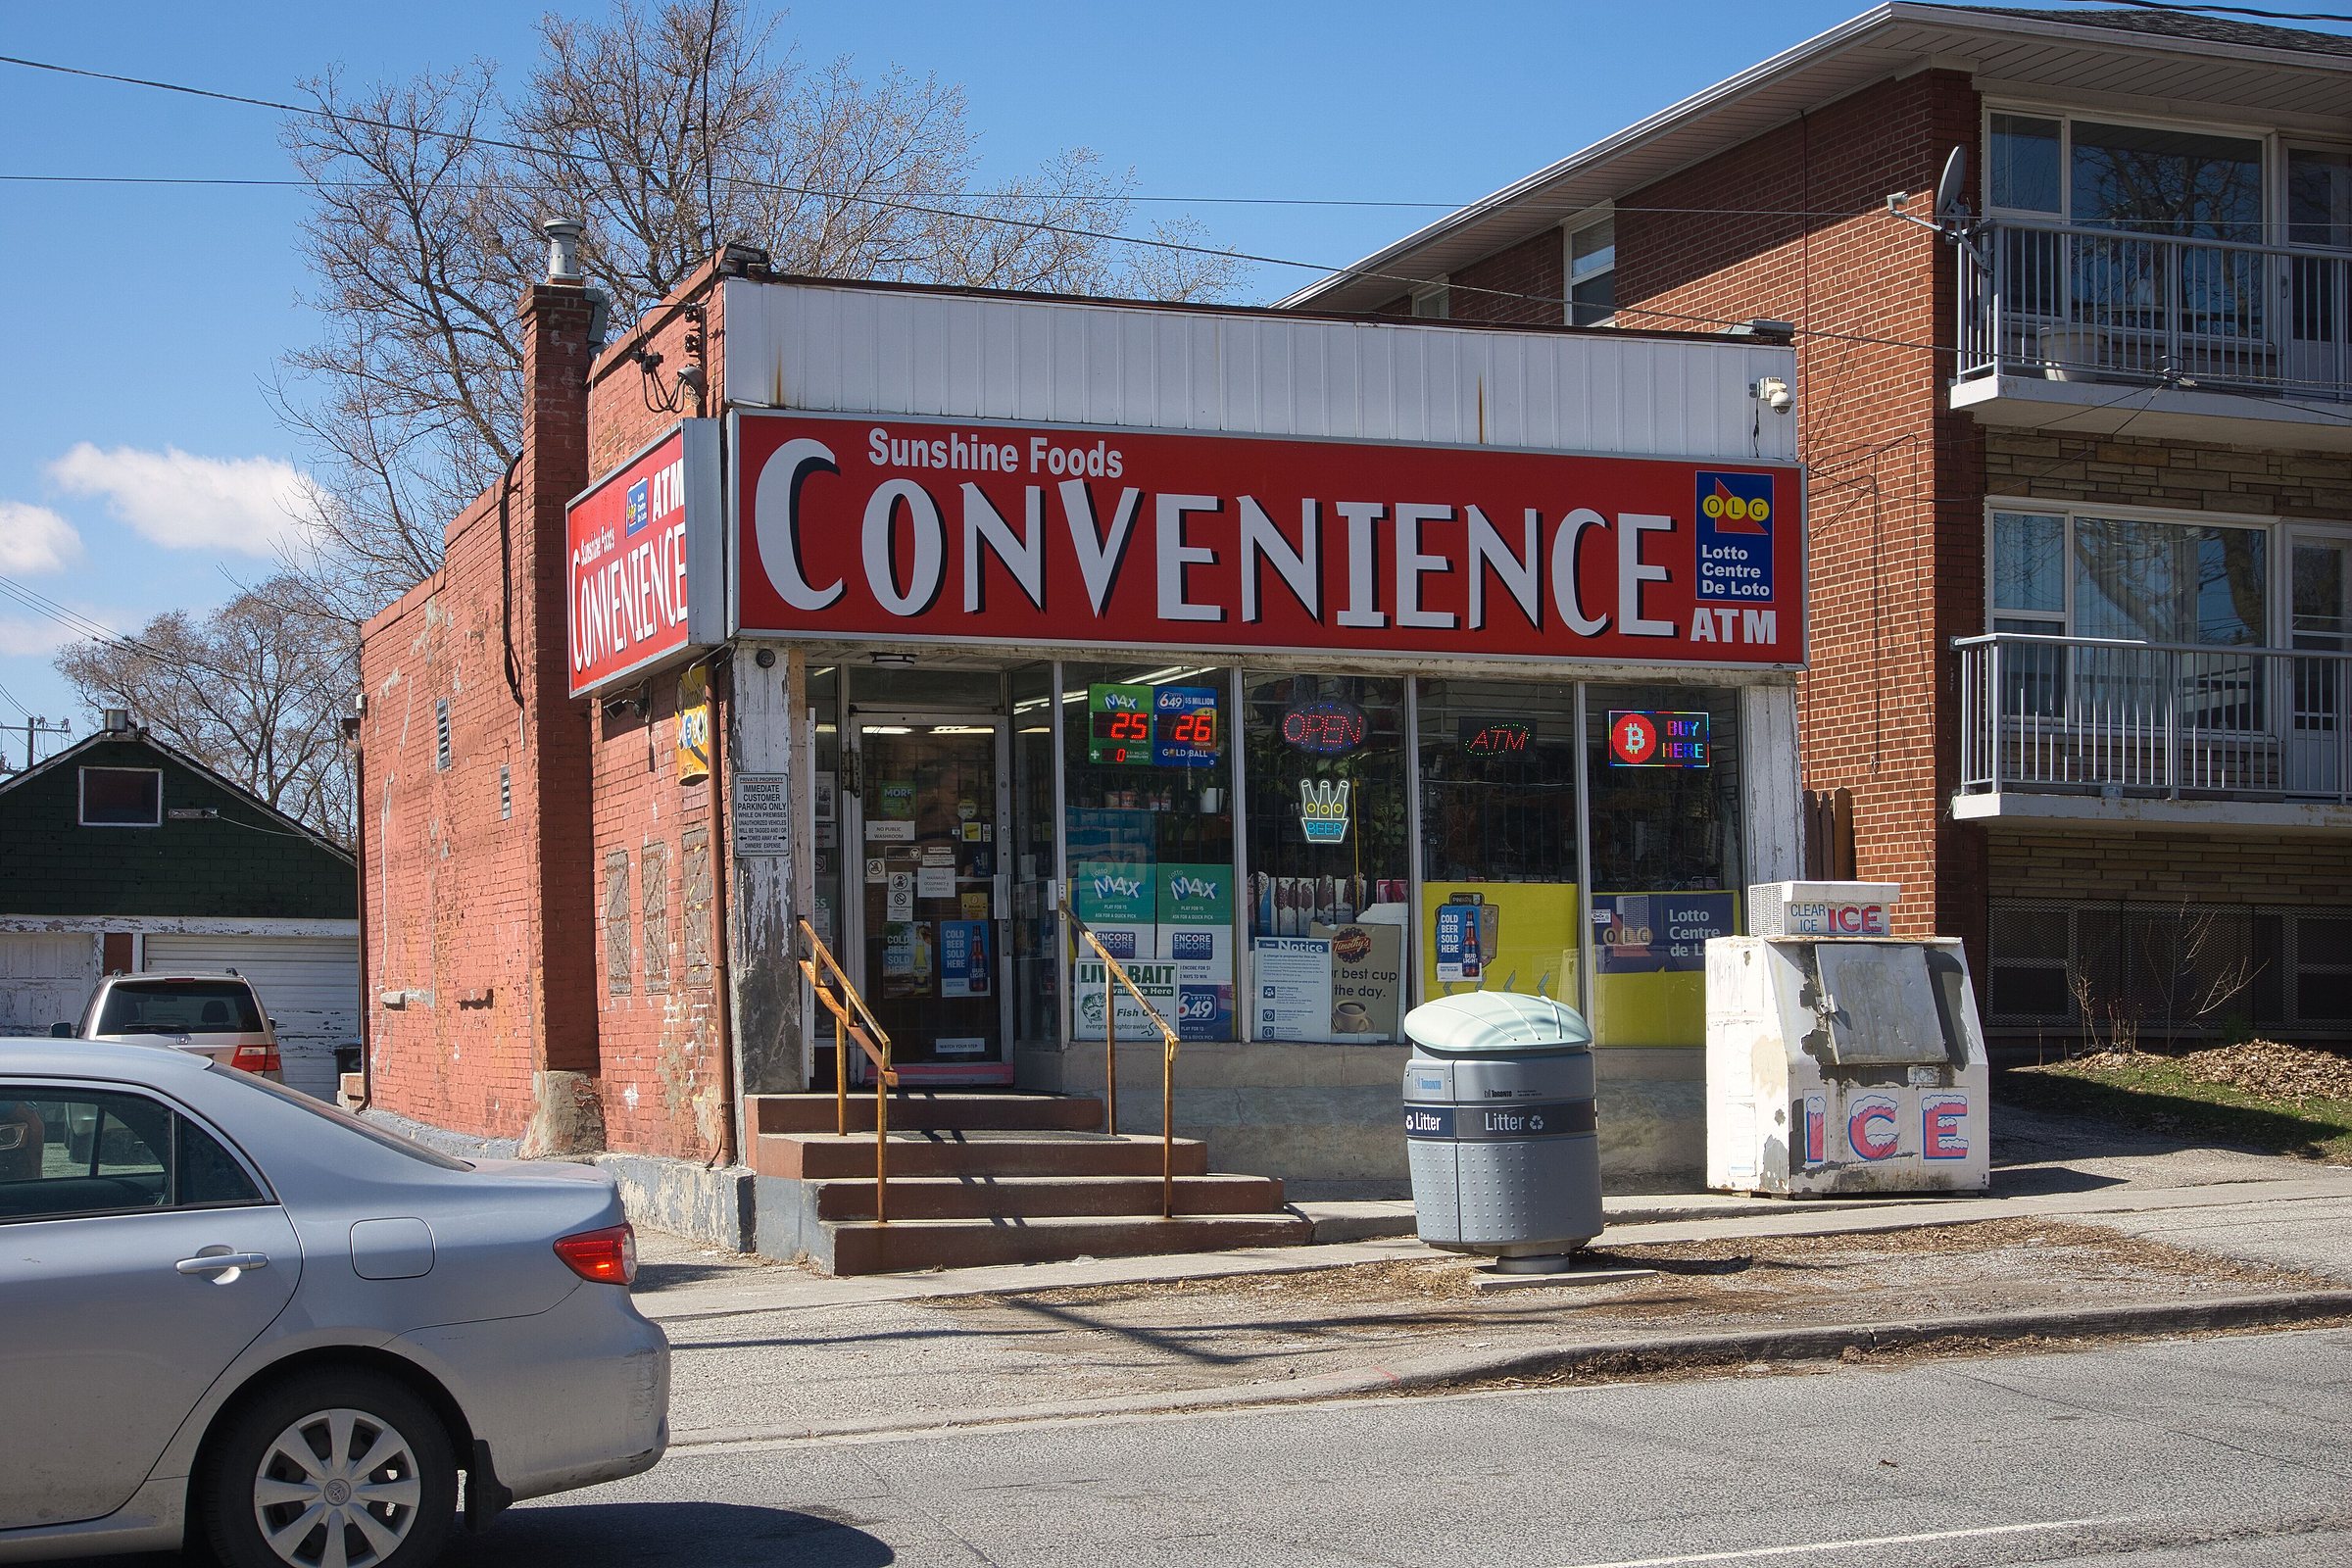
An independent convenience store in Toronto. The program began as software for neighbourhood retail, then narrowed to what one site could carry. Photo: Chicken4War, CC BY-SA 4.0, via Wikimedia Commons.

The program, Corner, ran from late April to mid July 2026. It began as a neighbourhood-retail software platform, narrowed to the question of what the site itself could carry, and ended the day the last candidate use was falsified. Each concept below is listed with what killed it, because the kill reasons are the study’s actual findings.

Eight concepts entered. What killed each one, and when.
  1. CPG micro-retailParked. Payment processing takes about 15% of a $2.50 basket, at any volume.Apr 30 → Jul 13
  2. Staffed bubble teaRejected the same day it was proposed. It set the rule of no staff in store operations.Jul 13
  3. Unattended bubble teaPivoted. Tapioca needs a heated hold, the exact burden an unattended format cannot carry lightly.Jul 13 → 14
  4. Unattended smoothieKilled. The one measured figure in the category is 6.8 cups a day, against a 12-cup floor. Capital of $26K to $37.6K pays back in 2.2 to 3.3 years, past the 24-month line. Better-funded operators ran it first and lost.Jul 14
  5. Prepackaged cold drinksPassed every format test and was never falsified. It closed with the site and is the most revivable line.Jul 13 → 14
  6. Venue-placed unitsClosed. Where these machines survive, venue service fees carry them, not cup margins.Jul 14
  7. Private training venueKilled on paper. Change-of-use permit, assembly-occupancy obligations, and clients crossing vehicle traffic on the lot.Jul 14
  8. Micro officeConsidered, then closed with the venue lines. The record holds no dated entry for it, and none is invented.undated → Jul 14
Figure 2.1The concept record. Every exit landed on July 13 or 14, when the evidence arrived together. One line, in blue, passed its own format tests and closed with the site.Program ledger and tracker, close-out record, July 2026.

What each concept met

CPG micro-retail. The founding concept: shelf goods, transparent platform pricing, phone checkout. Payment processing on a $2.50 convenience basket takes roughly 15 percent of revenue, at any volume, so the concept was parked. The platform shipped and works; the format waits for a higher-ticket application.

Staffed bubble tea. Recommended to the program, rejected the same day, and the rejection became standing doctrine: no human staff in store operations, ever. A format that only works with a shift worker is a different business than the one under study.

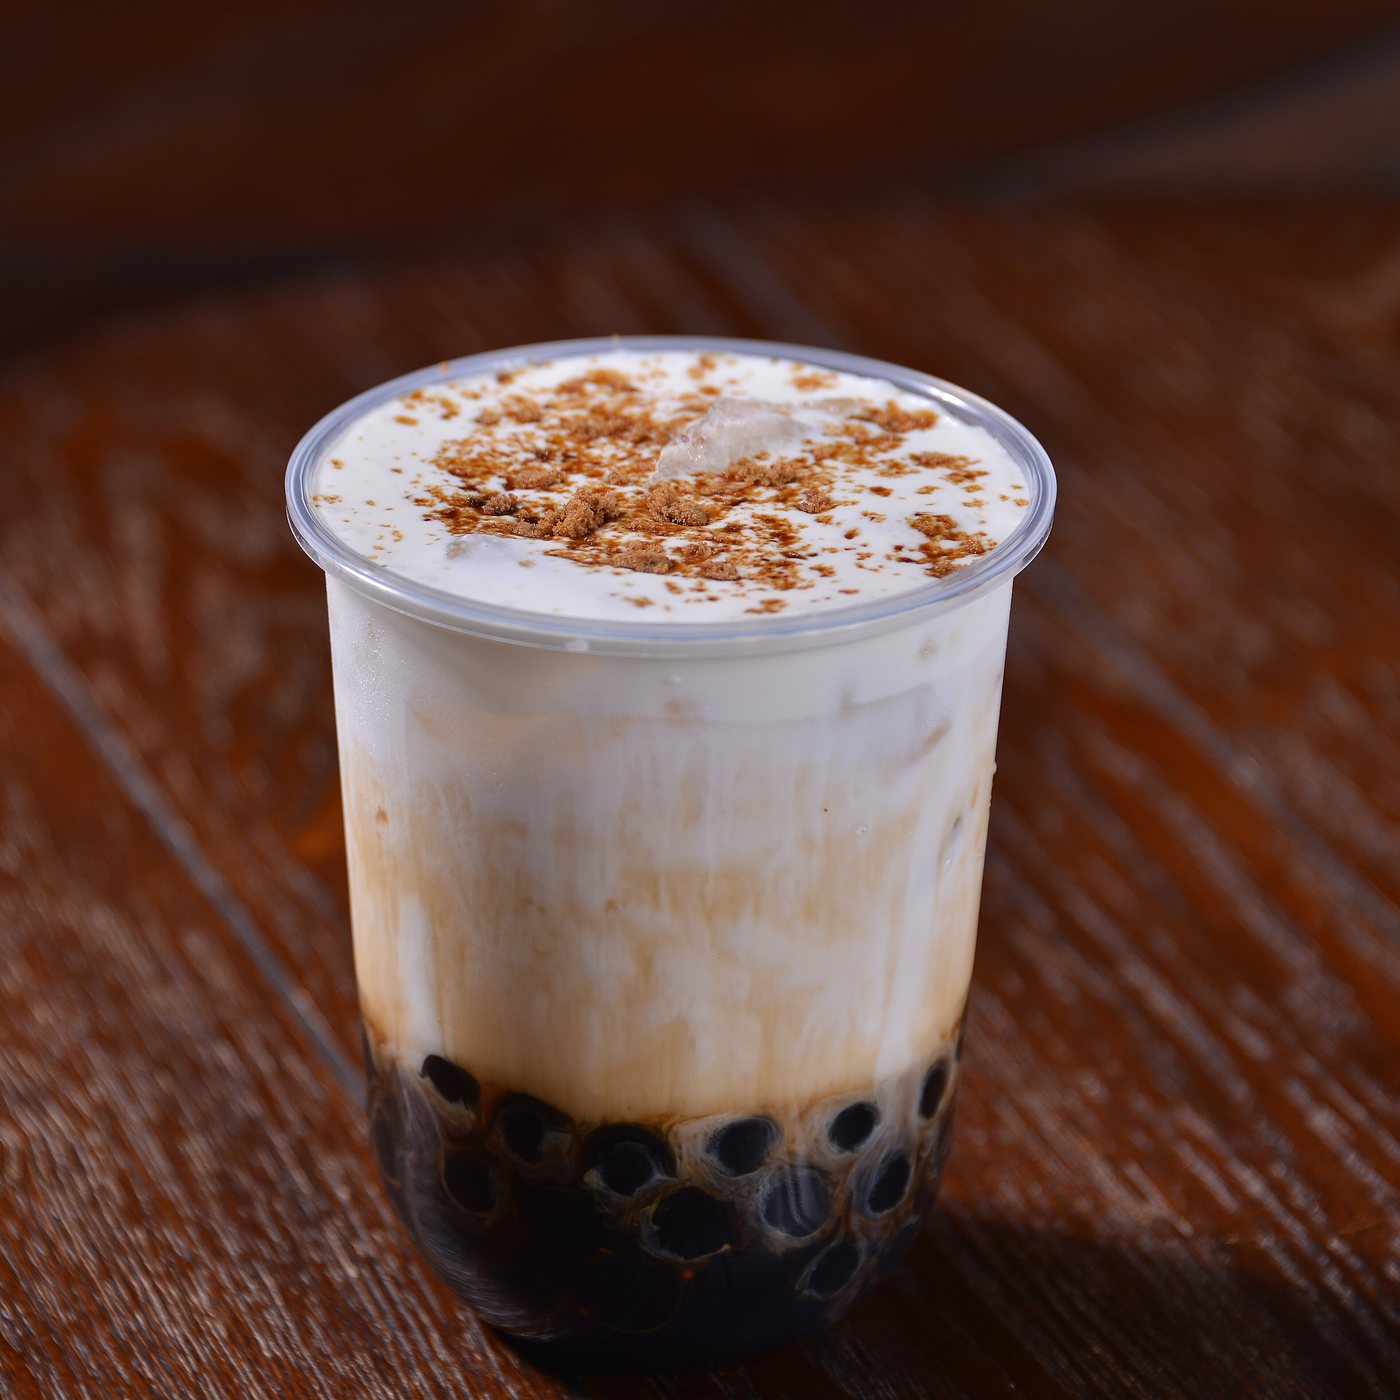
Unattended bubble tea, then smoothie. The core candidates. Bubble tea fell first, on a food-safety mechanic: tapioca requires a heated hold, and a heated hold of a time-and-temperature-controlled food is exactly the obligation an unattended format is least able to meet.

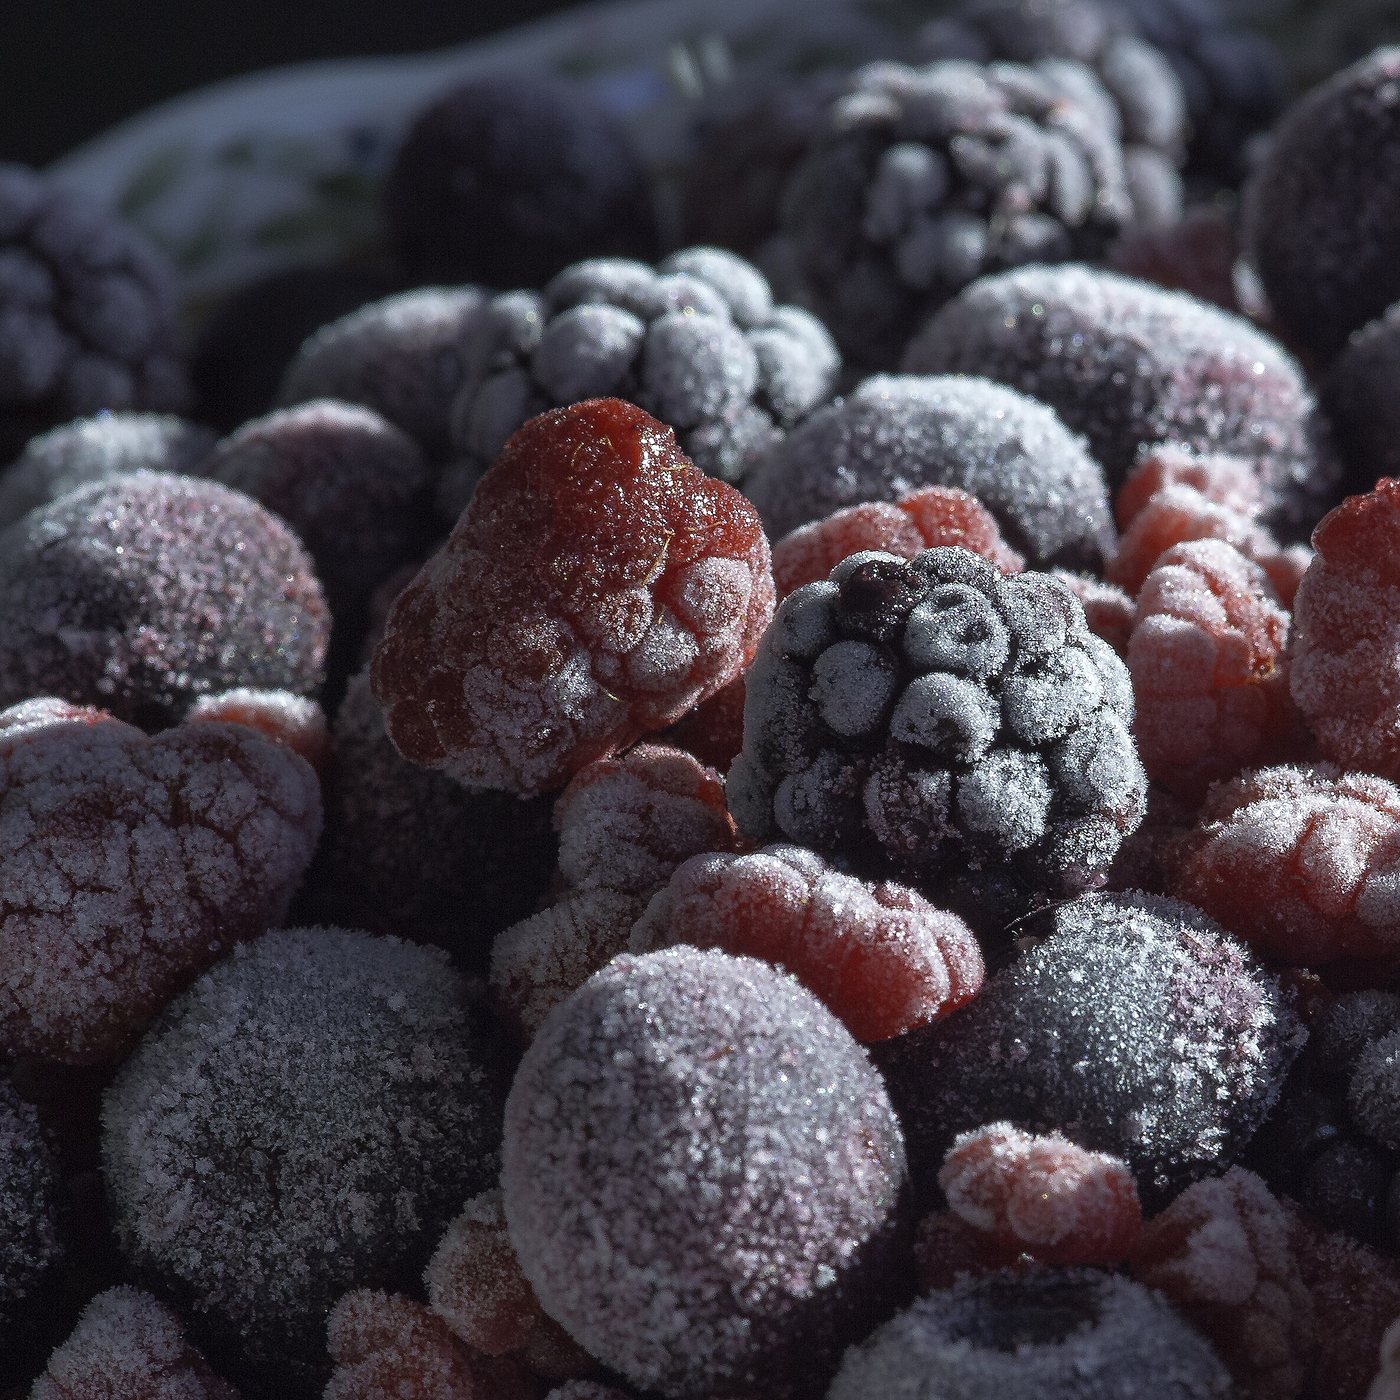
The pivot target, a smoothie format built on individually quick-frozen fruit, deletes that burden. It died a day later anyway, on the two findings of chapters 03 and 07: measured category demand below the model’s floor, and total capital that does not pay back inside the kill line. Appendix D is the third leg: better-funded operators had already run the experiment and lost.

The food-safety mechanic between the two core candidates.
A cup of milk tea with dark tapioca pearls settled at the bottom, on a wooden table
Frost-covered frozen raspberries, blackberries and blueberries
Figure 2.2Left: tapioca pearls at the bottom of a cup of bubble tea. Tapioca needs a heated hold, the burden an unattended format is least able to carry. Right: frozen berries. The smoothie format was built on individually quick-frozen fruit, which deletes that burden.Photos: left, sam651030, CC0; right, I saw_that, public domain; both via Wikimedia Commons.
A row of four brightly lit beverage vending machines along a wall in a Tokyo park
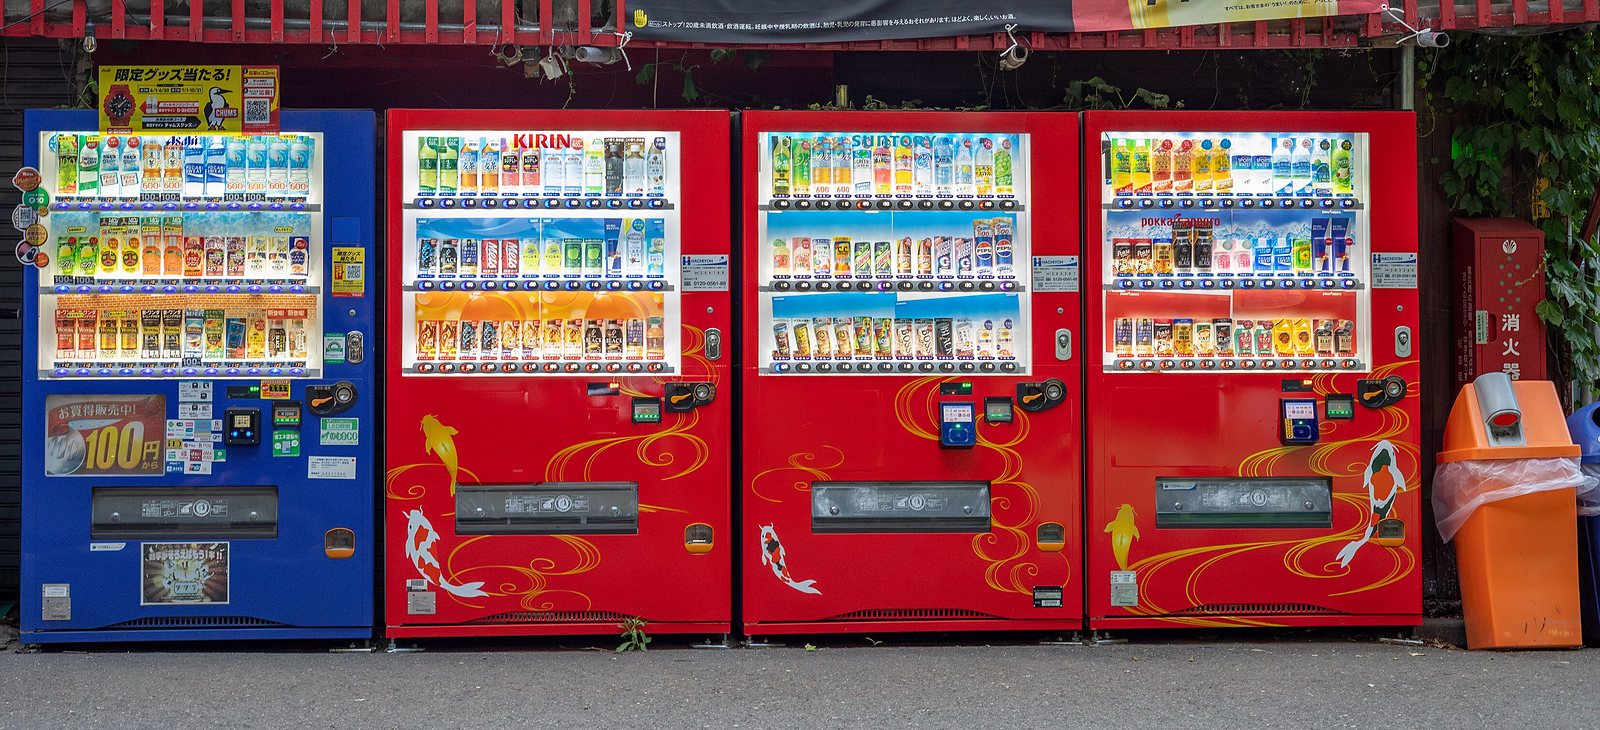
Figure 2.3Prepackaged cold drinks, unattended: beverage vending machines in Wadabori Park, Suginami, Tokyo, May 2024.Photo: Ximonic (Simo Räsänen), CC BY-SA 4.0, via Wikimedia Commons.

Prepackaged premium cold drinks. The low-risk format passed every regulatory and machine test in this study. It was swept away with the site, not falsified. Of everything in the funnel it remains the most revivable, on a different parcel.

Venue-placed units, and selling the machines. Floated on the final day and closed by the category evidence: where unattended drink machines survive, venue service fees carry them, not cup margins. Operating placed units is a real business, but it is a services business with a sales motion, which the studio was not going to bolt on to rescue a site.

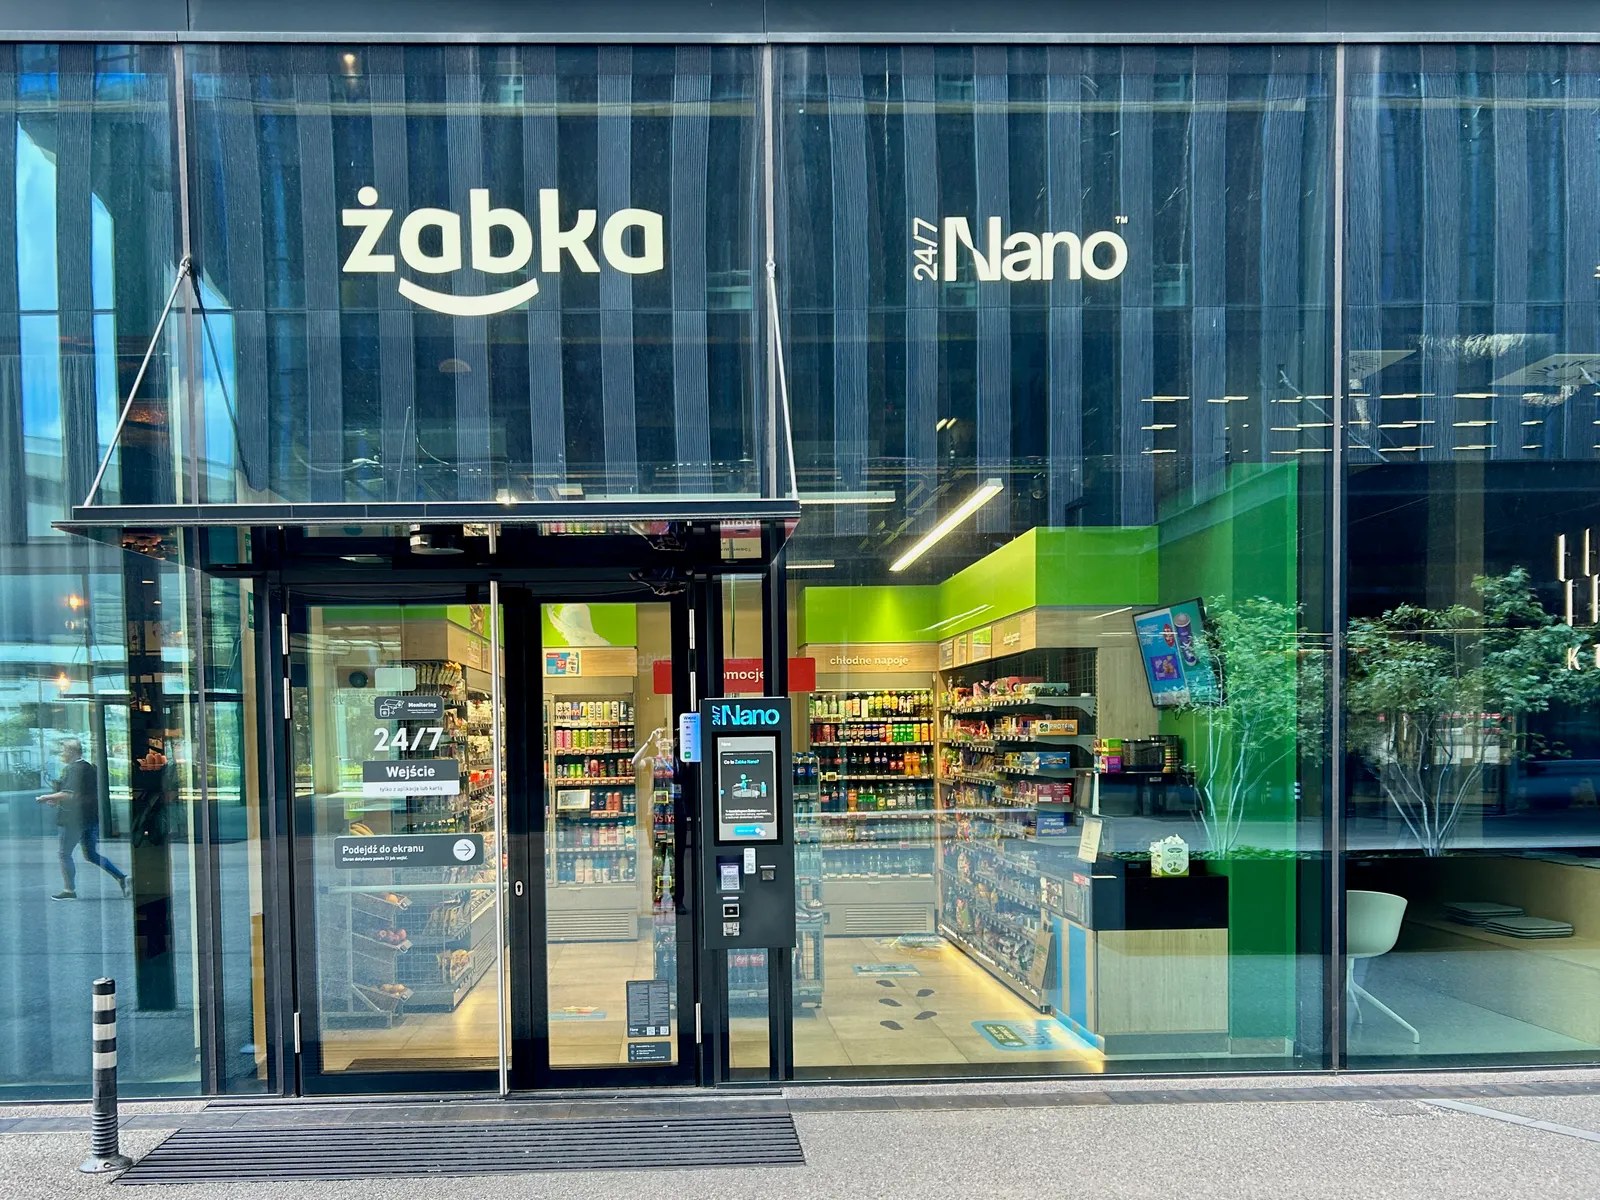
Street-facing Żabka Nano checkout-free store behind a glass facade in Katowice
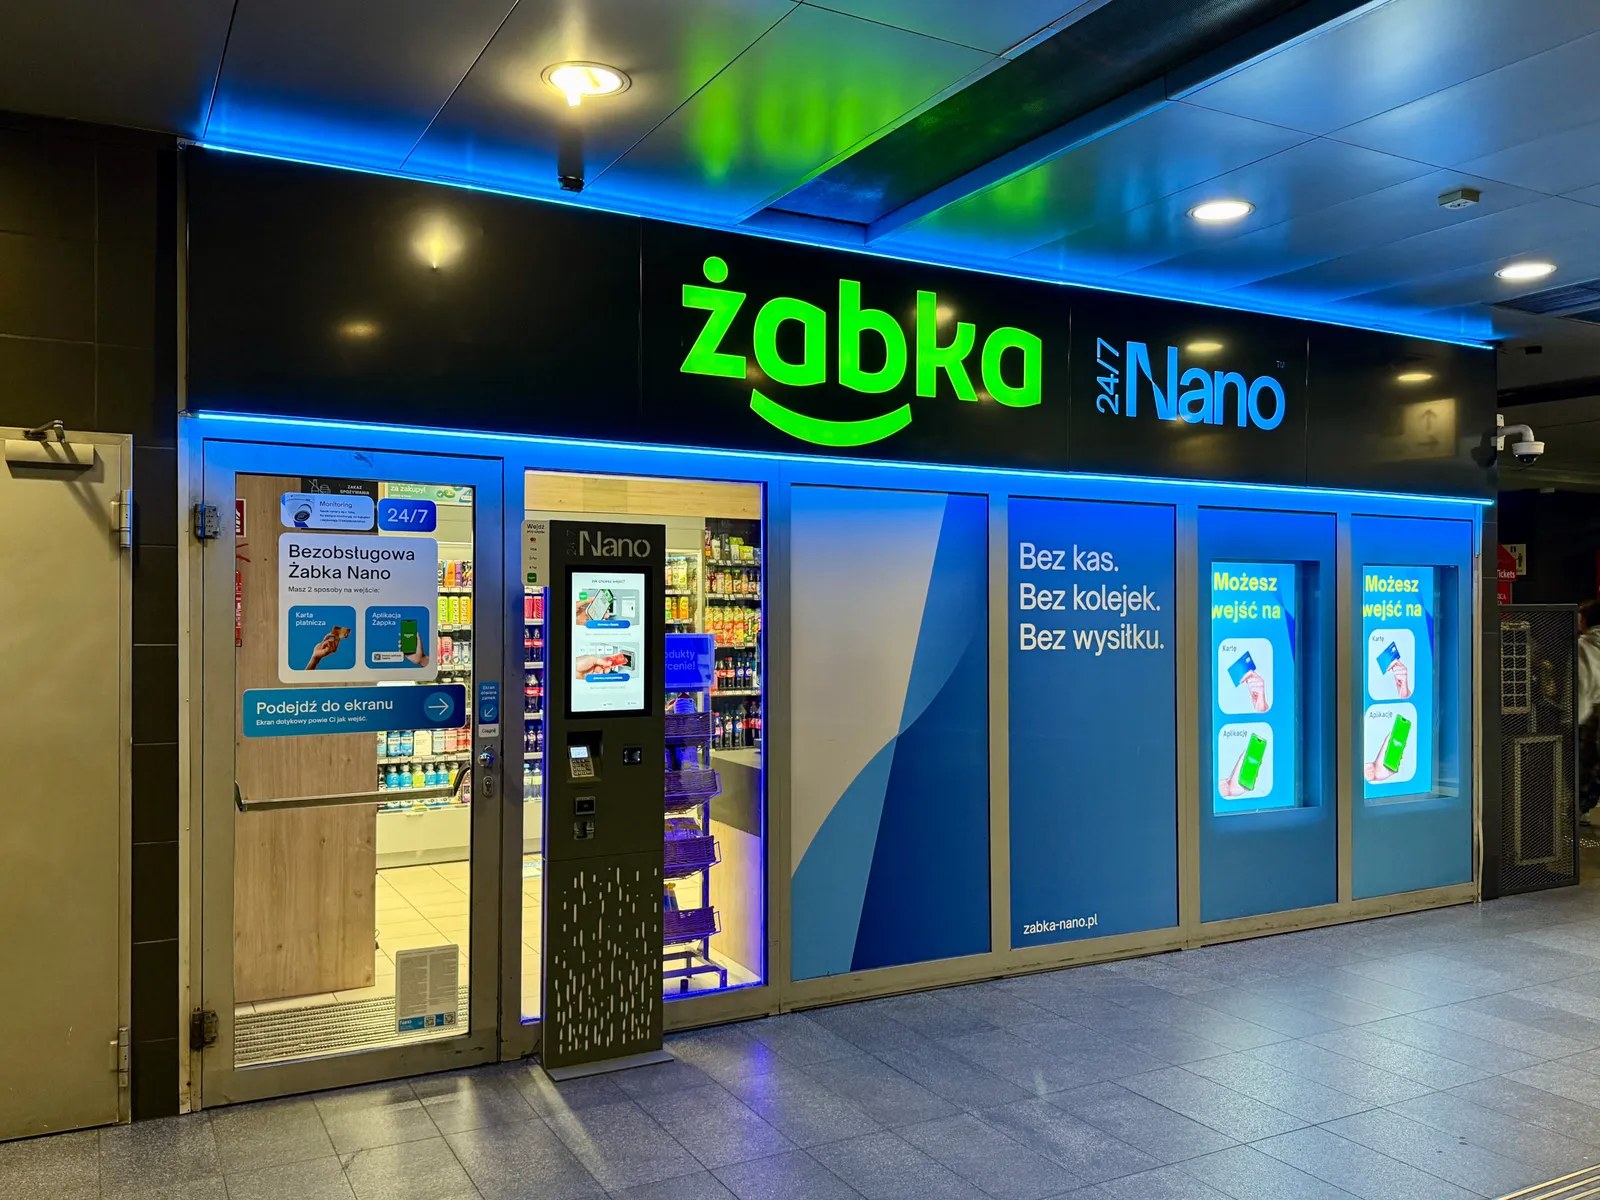
Żabka Nano checkout-free store inside a rail station concourse in Warsaw
Figure 2.4The format at incumbent scale. Left: a street-facing Żabka Nano checkout-free store in Katowice, Poland. Right: a venue-placed unit inside the Warszawa Gdańska rail station concourse, 2025. Europe’s largest autonomous-store chain runs both placements; the venue-placed unit is the shape the category evidence favours.Photos: left, Jonathan Deamer, CC BY 4.0; right, Cybularny, CC0; both via Wikimedia Commons.

Private training venue. The last non-retail reuse. It failed on paper before it failed on geometry: a change-of-use permit applies even without construction, a fitness use classifies as assembly occupancy under the building code, and a 240 square foot unplumbed structure cannot meet the washroom and barrier-free obligations that classification brings without disproportionate spend.1 Client access would still cross the vehicle plane hourly. The local market for hourly training space is also already served.

Micro office. Considered; closed with the venue line. The program’s record holds no dated entry for it, and the chart shows the gap.

The kill criteria

The fresh-drink format carried seven numbered criteria, set while the machine was still a spreadsheet line. Five are worth reading in full, because they did the killing or would have.

Table 2.1The kill criteria, verbatim from the program record. Read each row as: if this happens, do that.

#If this happensThen
K1Counted demand below 6 cups/day after the minimum sample; a go requires a counted base case of 12 or moreRe-site or re-product. Do not buy the machine.
K2No doctrine-compliant machine at or under $20K CAD landed, and no DIY build at or under $15K in partsWait or descope. The rules are not negotiable to make a purchase happen.
K5Machine availability under 95% in the first 60 days, any health-unit stop order, or more than two verified made-wrong incidentsHalt scale-out. Re-engineer before a second store.
K6Winter net below zero and trailing payback projecting past 24 monthsFormat kill. The structure reverts to storage.
K7The public-health unit classifies the operation as a food service premise requiring an on-site certified food handler, and no low-risk menu redesign escapes the classificationFormat kill for fresh drinks at this site. Doctrine forbids staffing around it.

K2 was falsified by research before any order was placed: no compliant machine lands under $20K (chapter 05). K1 was never run; the site died before the September counting window. K7 was never answered; the classification question’s public evidence is chapter 04.

What closed the program was not on this list at all: the category’s own published record and the total-capital arithmetic, both of them free and public the whole time. Walk-up circulation was not on the list either; chapter 08 records it as a bound on one structure, and it moved none of the arithmetic. The method note in Appendix C carries the amendment that follows: read the category’s record, and price what it costs to prove a model, before building the model.

Notes

  1. City of Hamilton Building Permit By-law 15-058 (change-of-use permit requirement); Ontario Building Code Group A-2 assembly classification and its washroom and barrier-free obligations, as assessed in the program’s close-out record, July 2026.
The Chicago skyline from the 16th Street bridge, a steel bascule bridge in the foreground

Chapter 03

Category analysis: unattended fresh-drink retail

The unattended fresh-drink category has exactly one measured throughput figure in its public record; this chapter is built around it.

In this chapter

  1. 3.1Throughput: the one real number
  2. 3.2Where the units live
  3. 3.3The economics the record supports
  4. 3.4The patent shadow
  5. 3.5The adjacent evidence

At a glance

6.8
cups a day: the category’s one measured throughput figure
12
cups a day: what this study’s cheapest case needs
~US$420K
of confirmed capital per placed unit

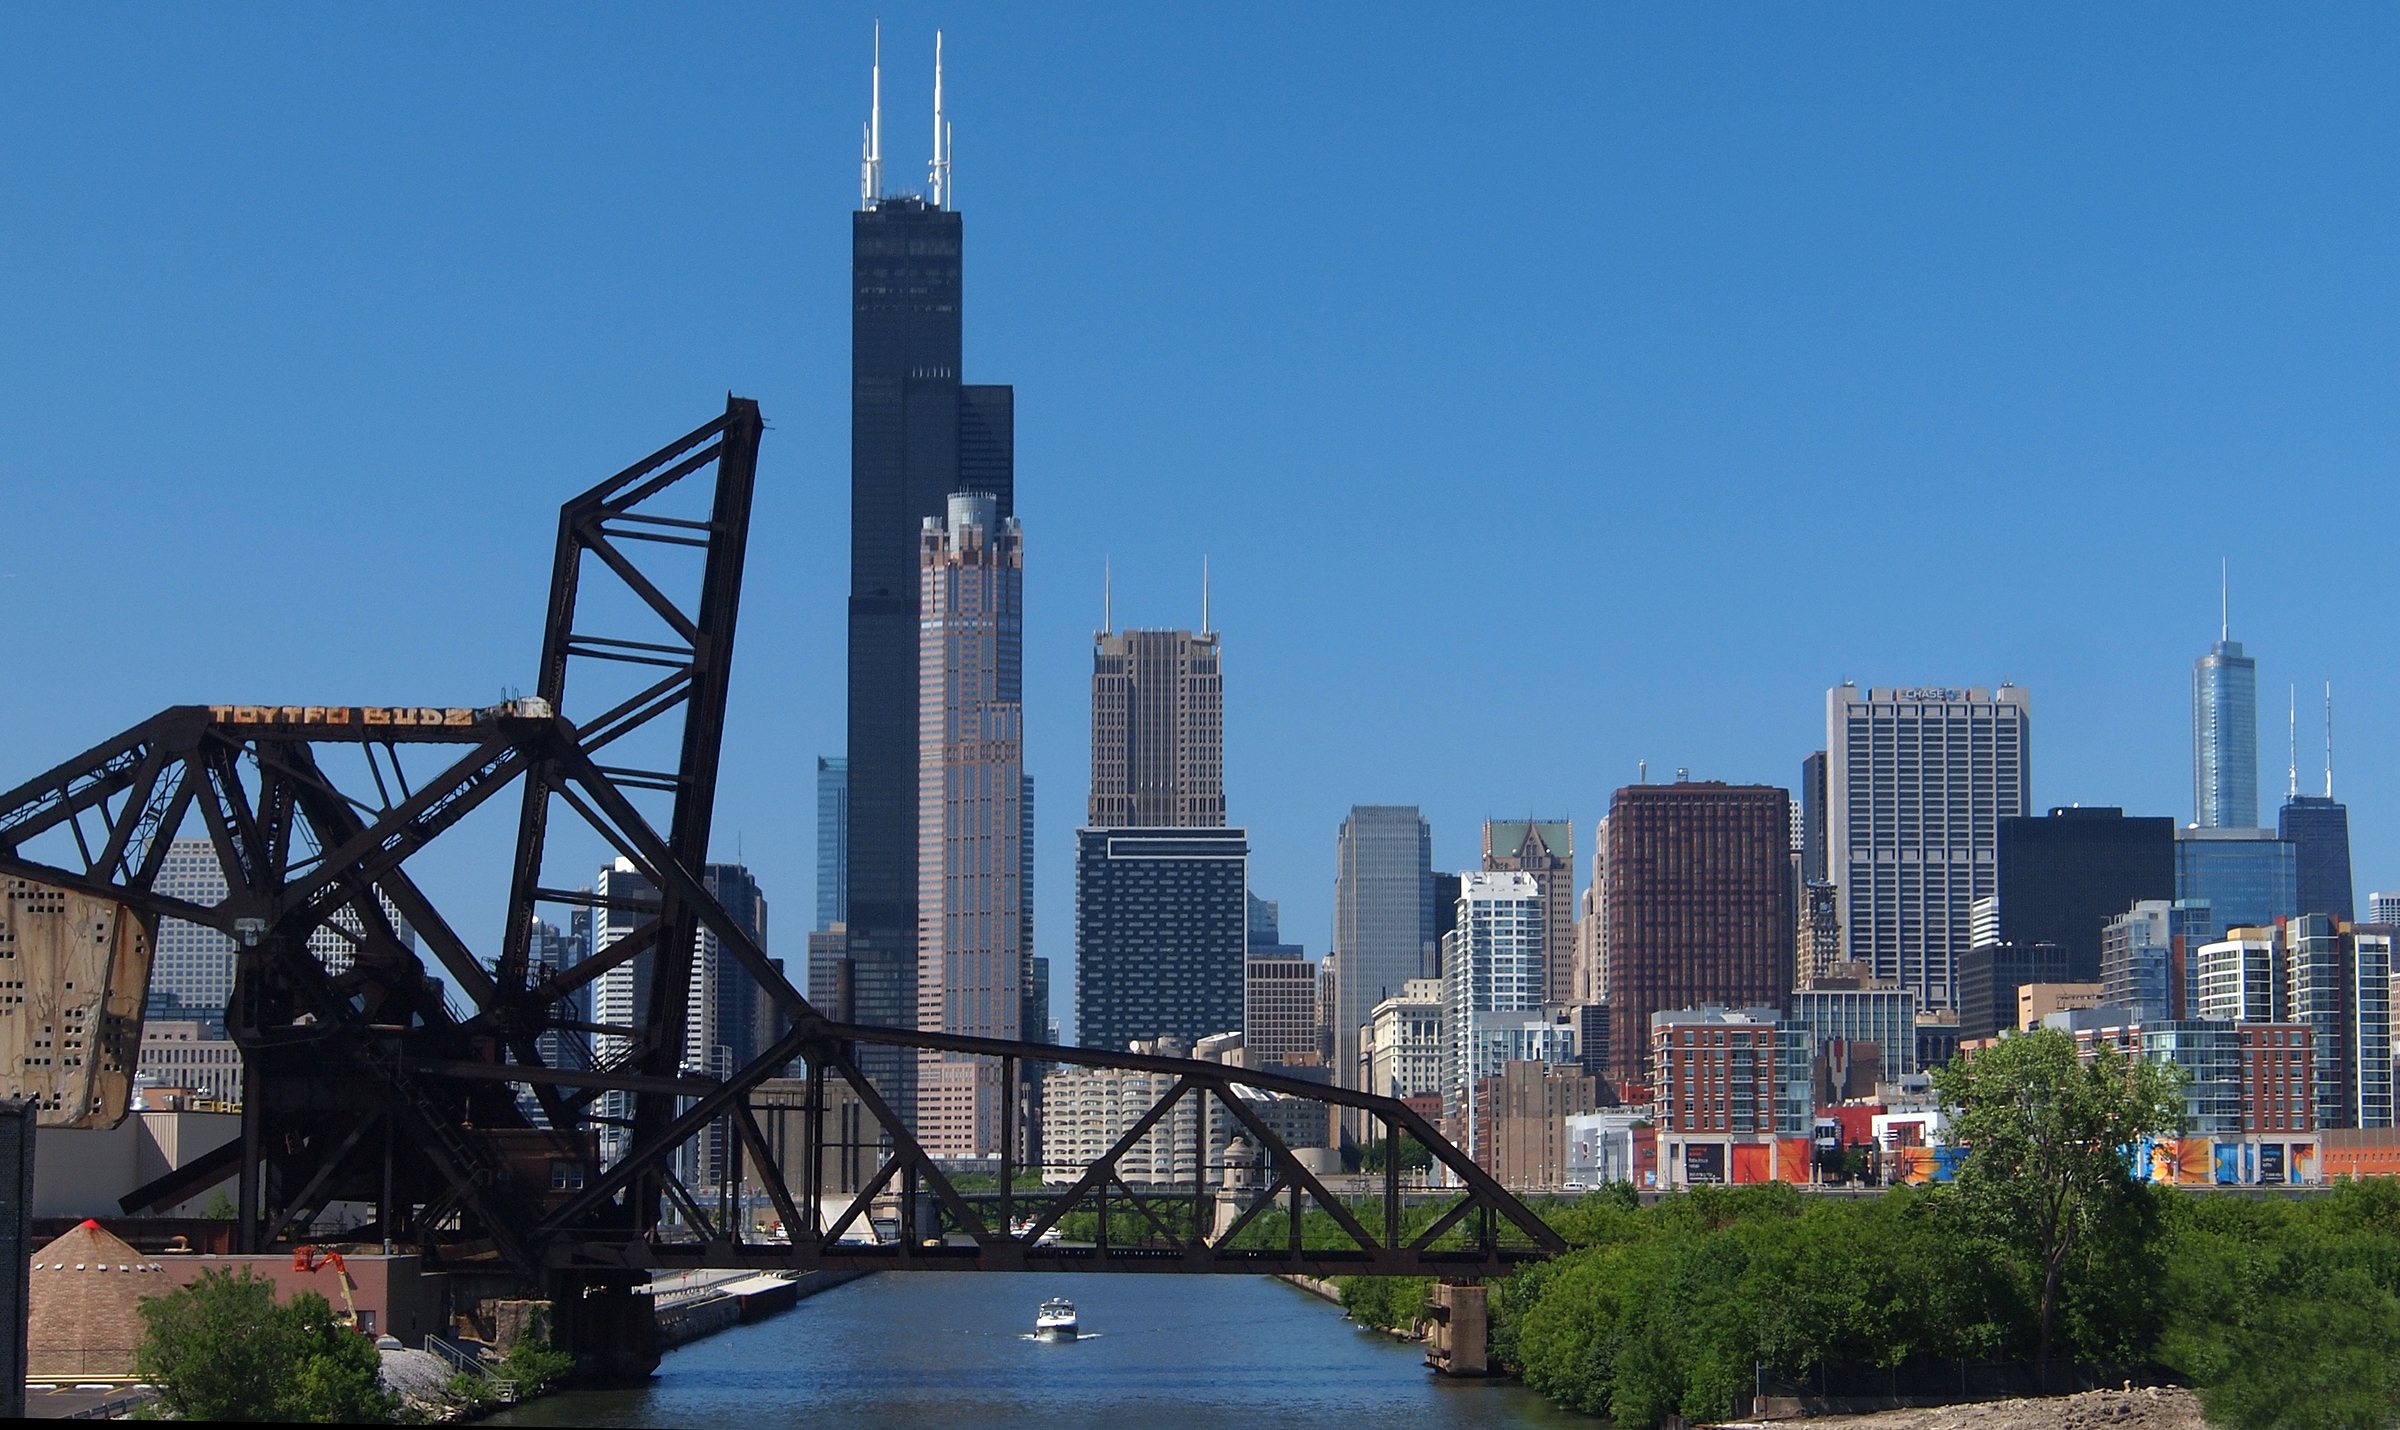
Chicago, from the 16th Street bridge. The category’s best-documented operator is a Chicago company. Photo: John Picken, CC BY 2.0, via Wikimedia Commons.

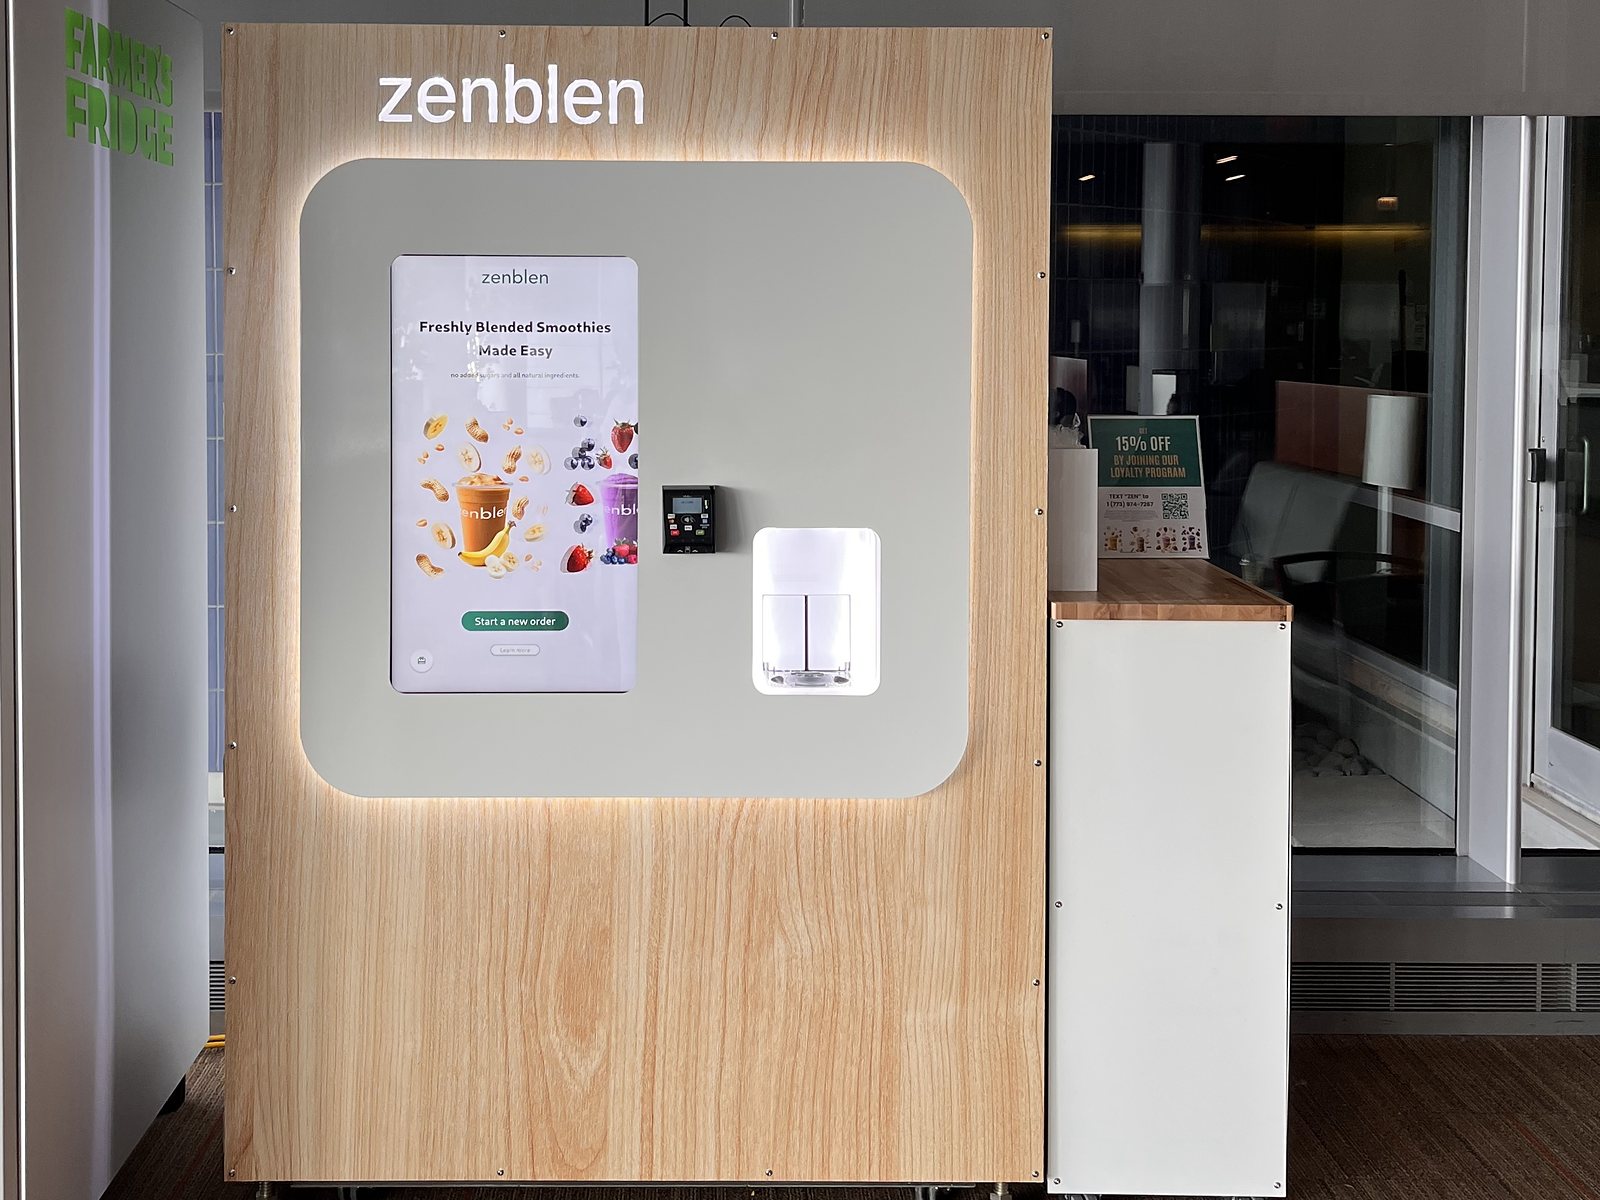
The best-documented operator in the category is Zenblen, a Chicago company running robotic smoothie kiosks. It is presented as the category’s best evidence, not as a target: the operator that has survived, iterated, raised institutional money, and placed units. Its public record is the most favourable data available on how the category performs.

Throughput: the one real number

In a 2024 interview, Zenblen’s founder stated the company “served over 2500 smoothies” from its field unit in 2023.1 Over a full year that is roughly 6.8 drinks per day.

The unit sits inside a members-only innovation hub, a captive and friendly population of habitual users. The hub’s own blog places the kiosk on site by May 2022, the year before the counted period, so the 6.8 reads as a mature rate rather than a ramp-up undercount.2 No later or better figure has been published by anyone in the category, in any climate, in any venue class.

The demand gap: the category’s best measured unit serves 6.8 cups a day. This study’s cheapest case needs 12.
01020304050cups per dayCategory best, measuredmature unit, captive venueCategory best, measured: 6.8 cups a day6.8Floor casethe minimum the model needsFloor case: 12 cups a day12Base caseBase case: 30 cups a day30Stretch caseStretch case: 45 cups a day45kill below 6go needs 12+
Figure 3.1The floor case, the minimum the smallest capital stack needs, sits 75 percent above the best measured mature rate anywhere in the category’s public record.6.8/day: 2,500 drinks in calendar 2023, operator interview (Ottomate News); scenarios: this study, ch. 07.

Where the units live

Zenblen lists eleven kiosks: university buildings, hospital towers, a members-only innovation hub, a residential building’s gym, a pilates studio.3 Checking each venue’s own published hours and access rules yields a clean structural finding: every unit sits inside an access-controlled or hours-limited building. None is street-facing; none can be reached by a member of the public walking up off a sidewalk, the use an unattended machine nominally exists for.3

Placement follows procurement, not retail siting. At two universities the kiosks arrived through the incumbent campus vending contractor, a division of Compass Group; the contractor’s regional director, not the startup, speaks for the expansion decision in the campus paper.4 A third campus lists the kiosk as a line item in the vending contractor’s procurement bid.5 The category leader’s distribution is the vending industry’s existing rails.

What the category leader’s placement looks like.
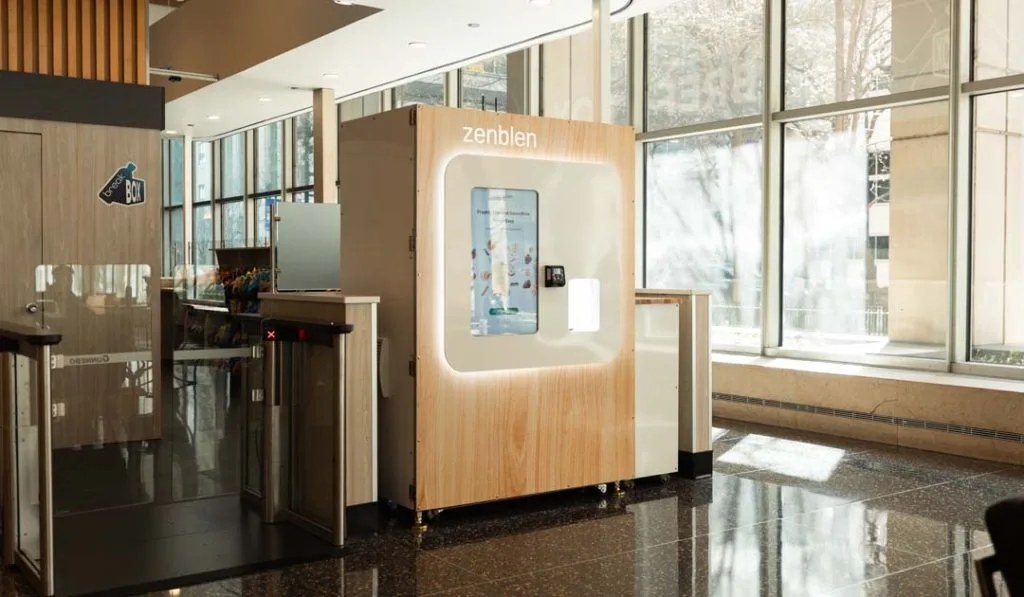
Zenblen robotic smoothie kiosk in a glass-walled building lobby next to security turnstiles
Figure 3.2A Zenblen kiosk in a Chicago building lobby, beside the security turnstiles. Indoors, access-controlled, procurement-placed. The full company record is Appendix D.Photo: Polsky Center for Entrepreneurship and Innovation, University of Chicago (2025).

The economics the record supports

On stage in 2026, the founder described two revenue lines: “we get revenue both from our location partners in terms of monthly service fee and we also get retail revenue from each smoothie we sold.”6 No dollar figure has been disclosed for either line. The venue pays for the amenity. The same pitch claims over 550 percent contribution margin, a six-month payback per kiosk, and 99 percent reliability; all are the operator’s own unaudited statements with no disclosed dollar basis, and are labelled here accordingly.6

The retail price point at one campus is US$8 per smoothie, per the student paper.4 The capital side is better documented: two SEC Form D filings confirm US$2,117,117 sold in the 2023 round and US$2,480,647 in the 2025–26 round, a floor of US$4.6 million across the two, against eleven placed units at the time of this audit.7

A US$6 million Series A was described by the founder as “closing” in the same 2026 pitch; no filing or press confirmation existed at this study’s access dates.6 Roughly US$420,000 of confirmed capital per placed unit is the ratio the public record supports.

Two revenue lines. The disclosed one is small; the undisclosed one carries the business.
Revenue line 1 · retail cups
US$8 a cup
one campus venue, 2026

At the one venue with a published count, cups move at about 6.8 a day. Call it US$54 a day of retail revenue, before costs.

Revenue line 2 · venue service fee
a monthly fee
paid by the location partner, amount undisclosed

The venue pays for the amenity. This line, not the cups, is what carries the business.

Figure 3.3The category’s revenue structure, as its best-documented operator describes it. The measured operators are venue-amenity businesses with a retail line, not standalone stores. The operator’s own unaudited pitch claims (“over 550% contribution margin,” “six-month payback,” “99%+ reliability”) disclose no dollar basis and are labelled in the text.Operator’s own statements (pitch, 2026; interview, 2024); SEC Form D filings, 2023 and 2026; campus press, 2026. Self-reported figures labelled.

The patent shadow

The blend mechanism itself is not open ground. F’real Foods holds two live United States patents on in-cup blending with an elevator assembly and removable spindle, expiring 2033 and 2037.8 A third patent often casually attributed to f’real, US10682942B2, in fact belongs to Tikiz Franchising and covers mobile-kiosk dispensing hardware; the correction matters because the misattribution circulates.8 Zenblen’s own application was allowed but not yet granted at this study’s access date.9

Whether any given built machine infringes the live claims is a freedom-to-operate question the public record cannot resolve; what the record does establish is that a new entrant’s cheapest mechanical path runs near claims in force until 2037, held by a patentee that has won an infringement verdict on its earlier blender patents.8

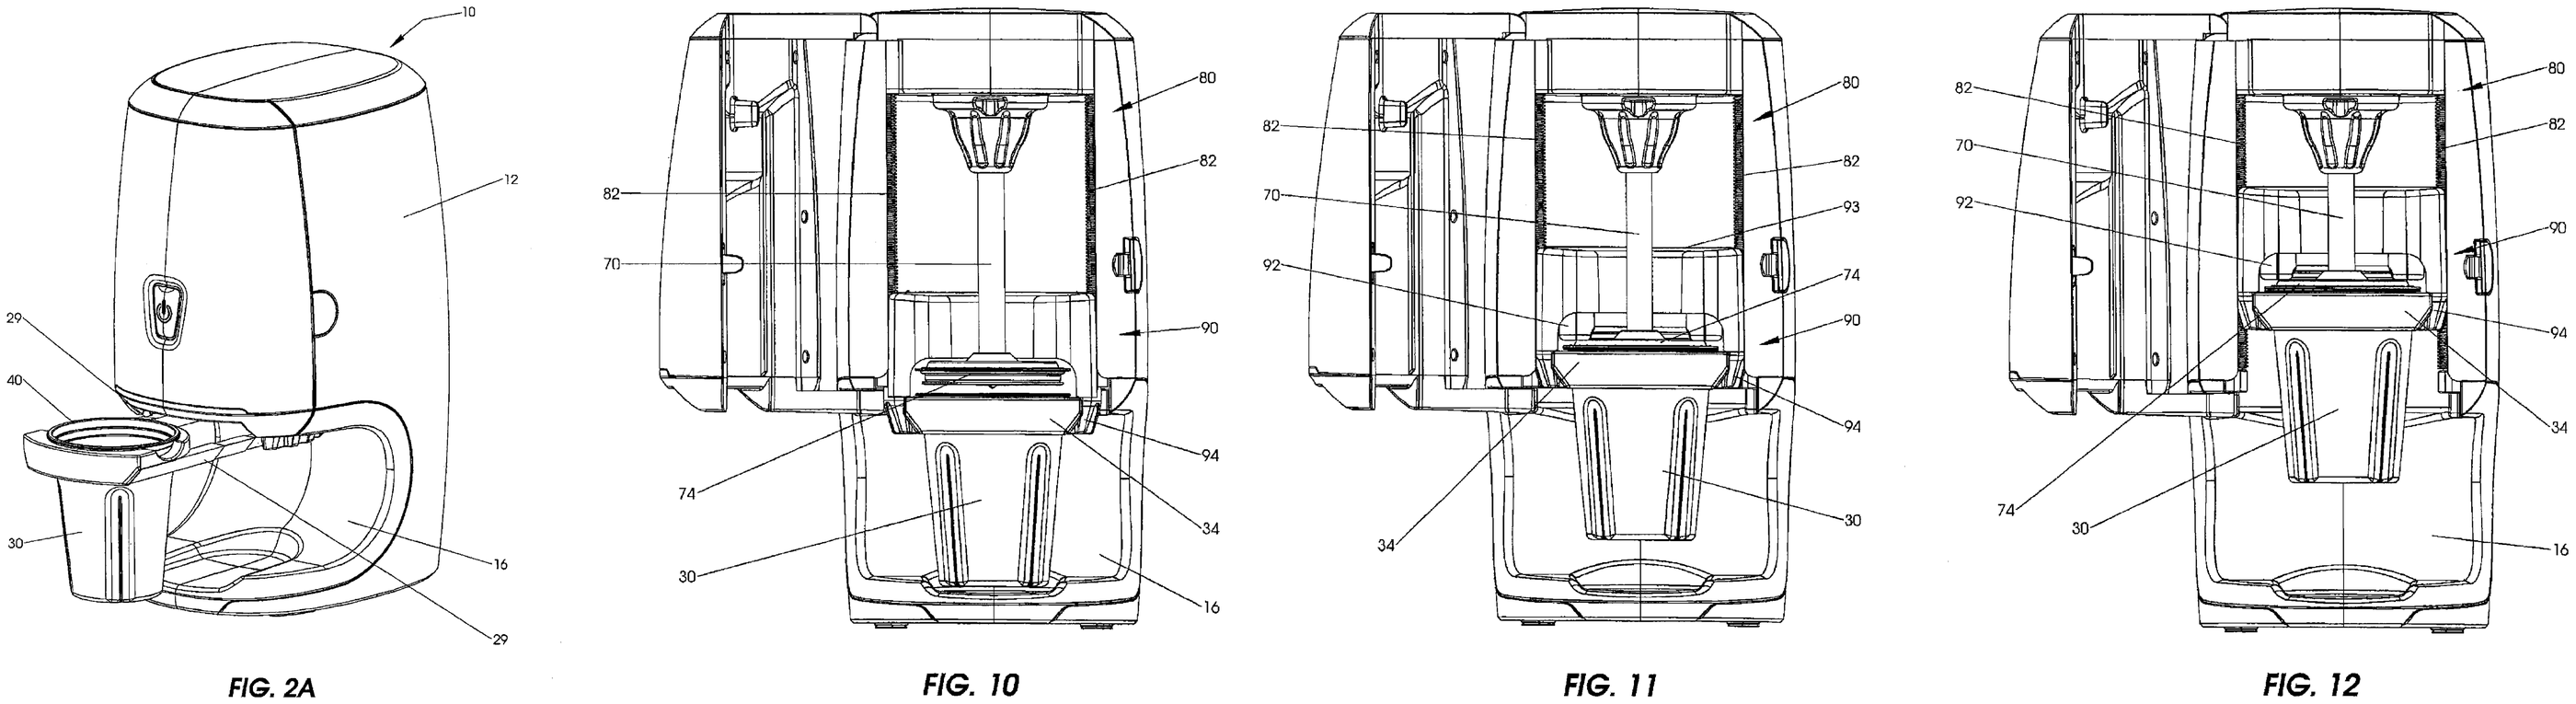
The patent shadow, in the patentee’s own drawings.
Four patent drawings of a countertop blending machine: a perspective view with a cup in its holder, and three cutaway views of an elevator lifting the cup toward a spindle
Figure 3.4Sheets from US 9,579,615 B2, “Blender with elevator assembly and removable spindle,” granted to f’real Foods on February 28, 2017, one of the two live patents above. From left: the machine with a cup in its holder (Fig. 2A), and the elevator assembly at three positions (Figs. 10 to 12).US 9,579,615 B2, sheets 3 and 11 to 13. United States Patent and Trademark Office.

The adjacent evidence

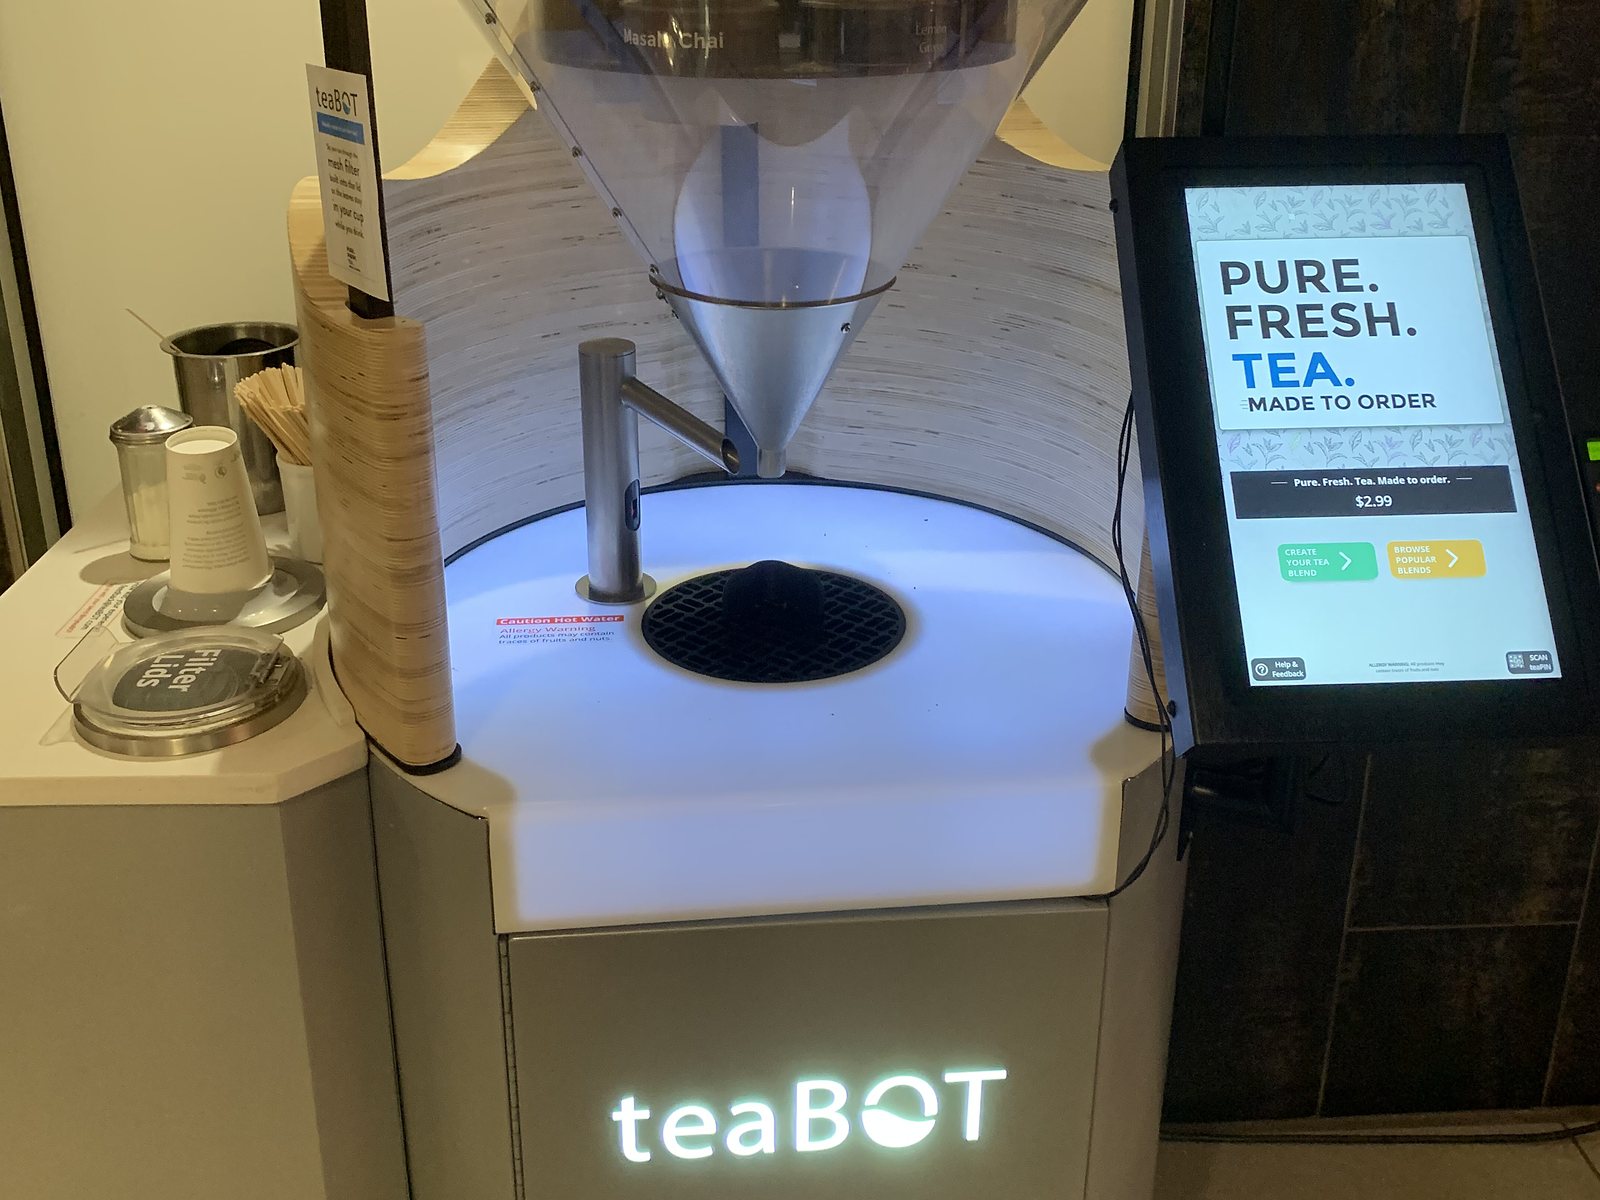
The two nearest comparators reinforce the read. teaBOT, the automated tea kiosk company, remains active after a decade; its chief executive simultaneously serves as Zenblen’s CTO per his own public profile, and appears on Zenblen’s first Form D but not its second.10

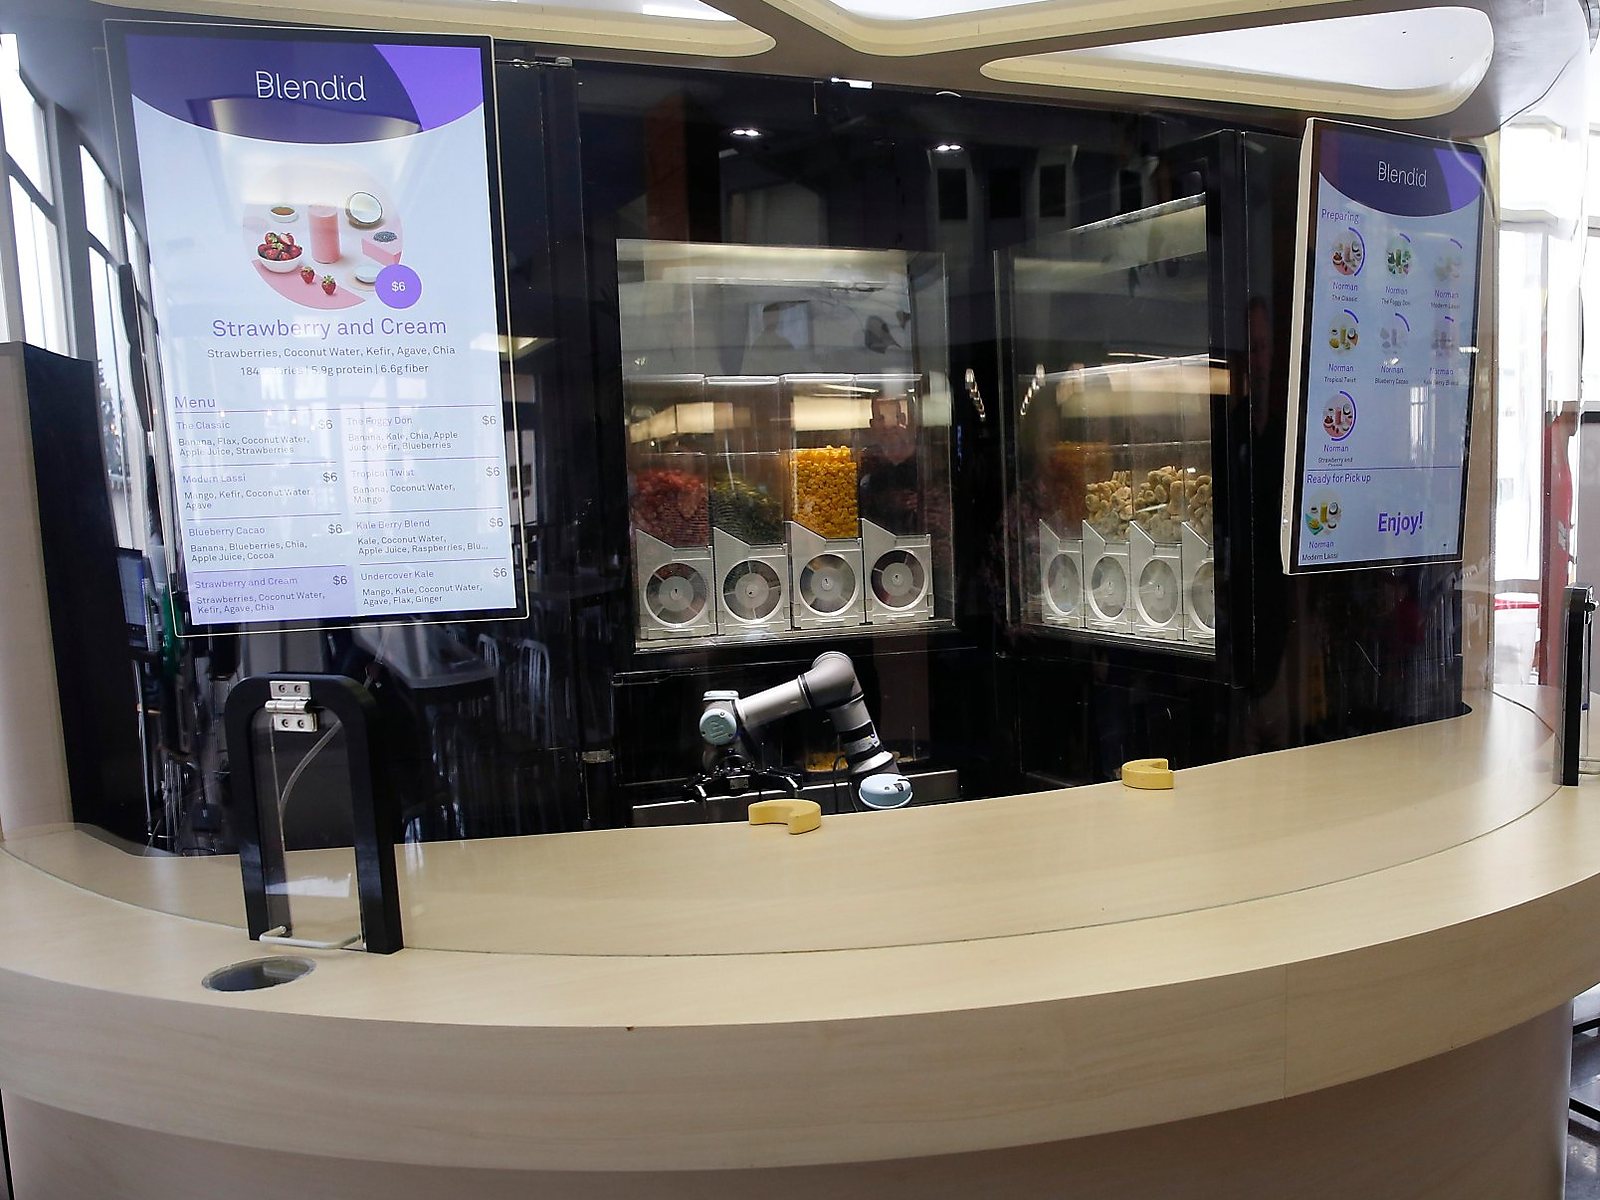
Blendid, the robotic smoothie company that raised venture capital for an eight-by-eight-foot robot-arm format, disclosed in its FY2025 annual report substantial doubt about continuing as a going concern if revenue targets are not met, thirteen employees, and a US$308,000 obsolete-inventory write-off. It stopped selling its original kiosk at the end of 2024 for two new products, a smaller, cheaper kiosk and a back-of-house unit, to be sold rather than leased.11 The direction of travel among the category’s established operators is uniform. Machines are getting smaller and cheaper, and operators place them in venues on service fees instead of on streets to earn cup margins.

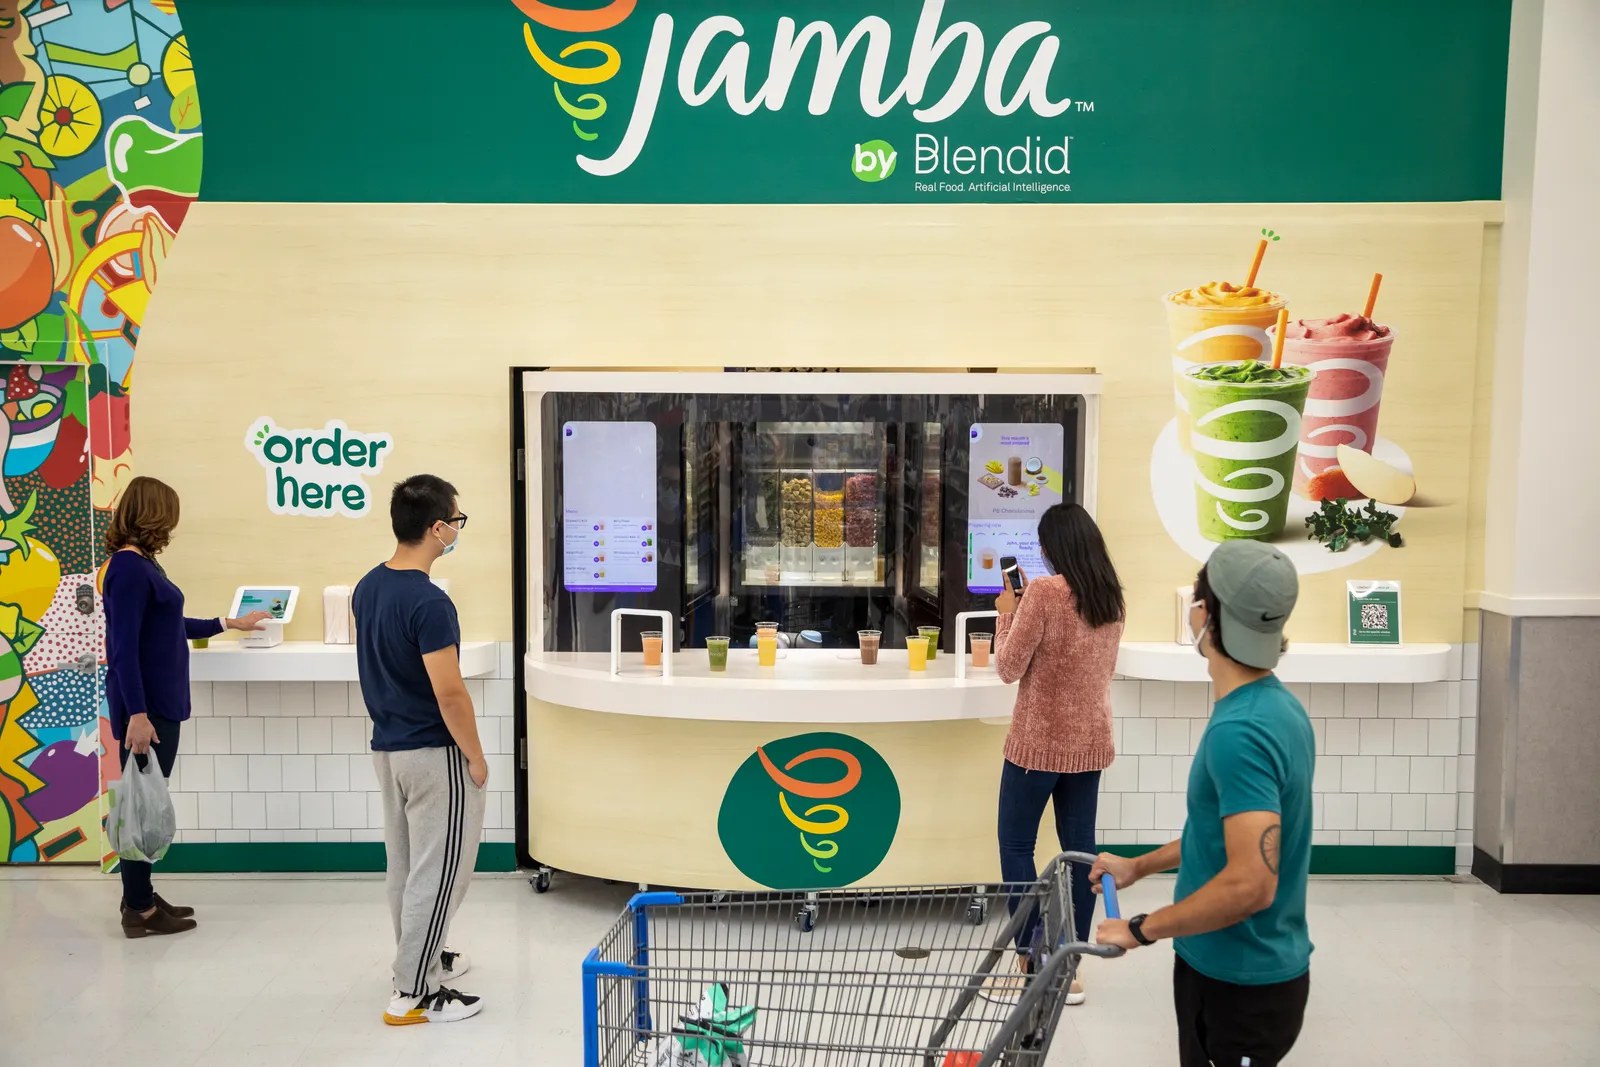
Shoppers order at the Jamba by Blendid robotic smoothie kiosk inside a Walmart, the robot arm working behind glass
Figure 3.5The Jamba by Blendid co-branded kiosk inside a Walmart in Dixon, California: the eight-by-eight-foot robot-arm format Blendid stopped selling at the end of 2024.Photo: Blendid, via The Spoon.

What the category’s public record supports: unattended fresh-drink machines survive as venue amenities on service-fee economics, inside access-controlled buildings, placed through vending-industry procurement.

What no public record supports: a street-facing unattended fresh-drink store carrying itself on cup margins. Nobody has published a case, and the one measured throughput figure is below every capital stack’s viability line in this study.

Notes

  1. Ottomate News, “Zenblen brings robo-crafted smoothies” (founder interview), ottomate.news/p/zenblen-brings-robo-crafted-smoothies, accessed 2026-07-14. The 2,500-smoothie figure is the operator’s own; 6.8/day is the naive full-year division.
  2. mHUB blog, “Hardtech startup Zenblen inspires healthy consumption,” published 2022-05-23, mhub.org, accessed 2026-07-14; IIT Institute of Design article, published 2020-11-05, iit.edu, accessed 2026-07-14.
  3. zenblen.com/find-a-kiosk, accessed 2026-07-14; each venue’s access reality checked against the venue’s own published hours pages (rush.edu, lib.uchicago.edu, mhubchicago.com, rentnemachicago.com, onyxpilates.com, and others), all accessed 2026-07-14.
  4. The Daily Northwestern, “Second Zenblen smoothie machine installed in Main Library,” 2026-05-26, accessed 2026-07-14. Canteen (Compass Group) senior regional director quoted on the expansion decision; US$8 price point per a student quoted in the same article.
  5. College of DuPage vending-services procurement solicitation, June 2025, cod.edu (PDF), indexed via search snippet, accessed 2026-07-14.
  6. mHUB HardTech Summit pitch (video uploaded 2026-03-25), youtube.com/watch?v=wW6zQRT78pA at 41:28–44:18, auto-caption transcription, accessed 2026-07-14. All figures in that segment are the operator’s own unaudited statements.
  7. SEC EDGAR, Zenblen, Inc. (CIK 0001993331), Form D filed 2023-09-18 (US$2,117,117 sold of a US$2,840,275 offering, 34 investors) and Form D filed 2026-01-21 (US$2,480,647 sold, offering indefinite, 12 investors), both accessed 2026-07-14. Commonly cited broker figures (US$2.84M, US$3.55M) understate the SEC-confirmed total.
  8. US9579615B2 (expires 2033) and US10299628B2 (expires 2037), assignee F’real Foods LLC; US10682942B2, assignee Tikiz Franchising, LLC. patents.google.com, all accessed 2026-07-14. The verdict: f’real Foods and Rich Products v. Hamilton Beach Brands and Hershey Creamery (D. Del.), a jury verdict of May 2019 on three earlier f’real patents, affirmed by the Federal Circuit on 2021-07-21 (Law360, 2019-05-03; Morris Nichols, 2021-07-21), accessed 2026-10-02.
  9. US20220160162A1, Zenblen, Inc., legal-events table showing the application allowed, with the notice of allowance not yet mailed, as its last indexed event (2026-04-12). patents.google.com, accessed 2026-07-14. Rechecked 2026-10-02: a later entry records the notice as mailed on 2026-04-14, and the application is still listed as pending.
  10. LinkedIn public profile headline (“CEO @ teaBOT + CTO @ Zenblen”), ca.linkedin.com/in/rehmanmerali, accessed 2026-07-14; presence on the 2023 Form D and absence from the 2026 Form D per note 7.
  11. 6d bytes inc. (Blendid) FY2025 annual report (year ended 2025-10-31, filed 2026-03-02), SEC EDGAR CIK 1830909, accessed 2026-07-14. Going-concern language, headcount, write-offs, and the product transition are the filing’s own disclosures.
The Ontario Legislative Building at Queen’s Park, Toronto, at the end of a garden path under a blue sky

Chapter 04

Regulatory posture

On paper, an unattended fresh-drink kiosk in Ontario needs a trained human standing next to it. In practice, two cities’ own open data show the paper is not how the category is policed.

In this chapter

  1. 4.1Ontario, on paper
  2. 4.2Toronto, in practice
  3. 4.3Chicago, in practice

At a glance

104,790
inspection records in Toronto’s DineSafe dataset
0
records for the unattended espresso operator, across nearly six years
26
logged queries against Chicago’s open data

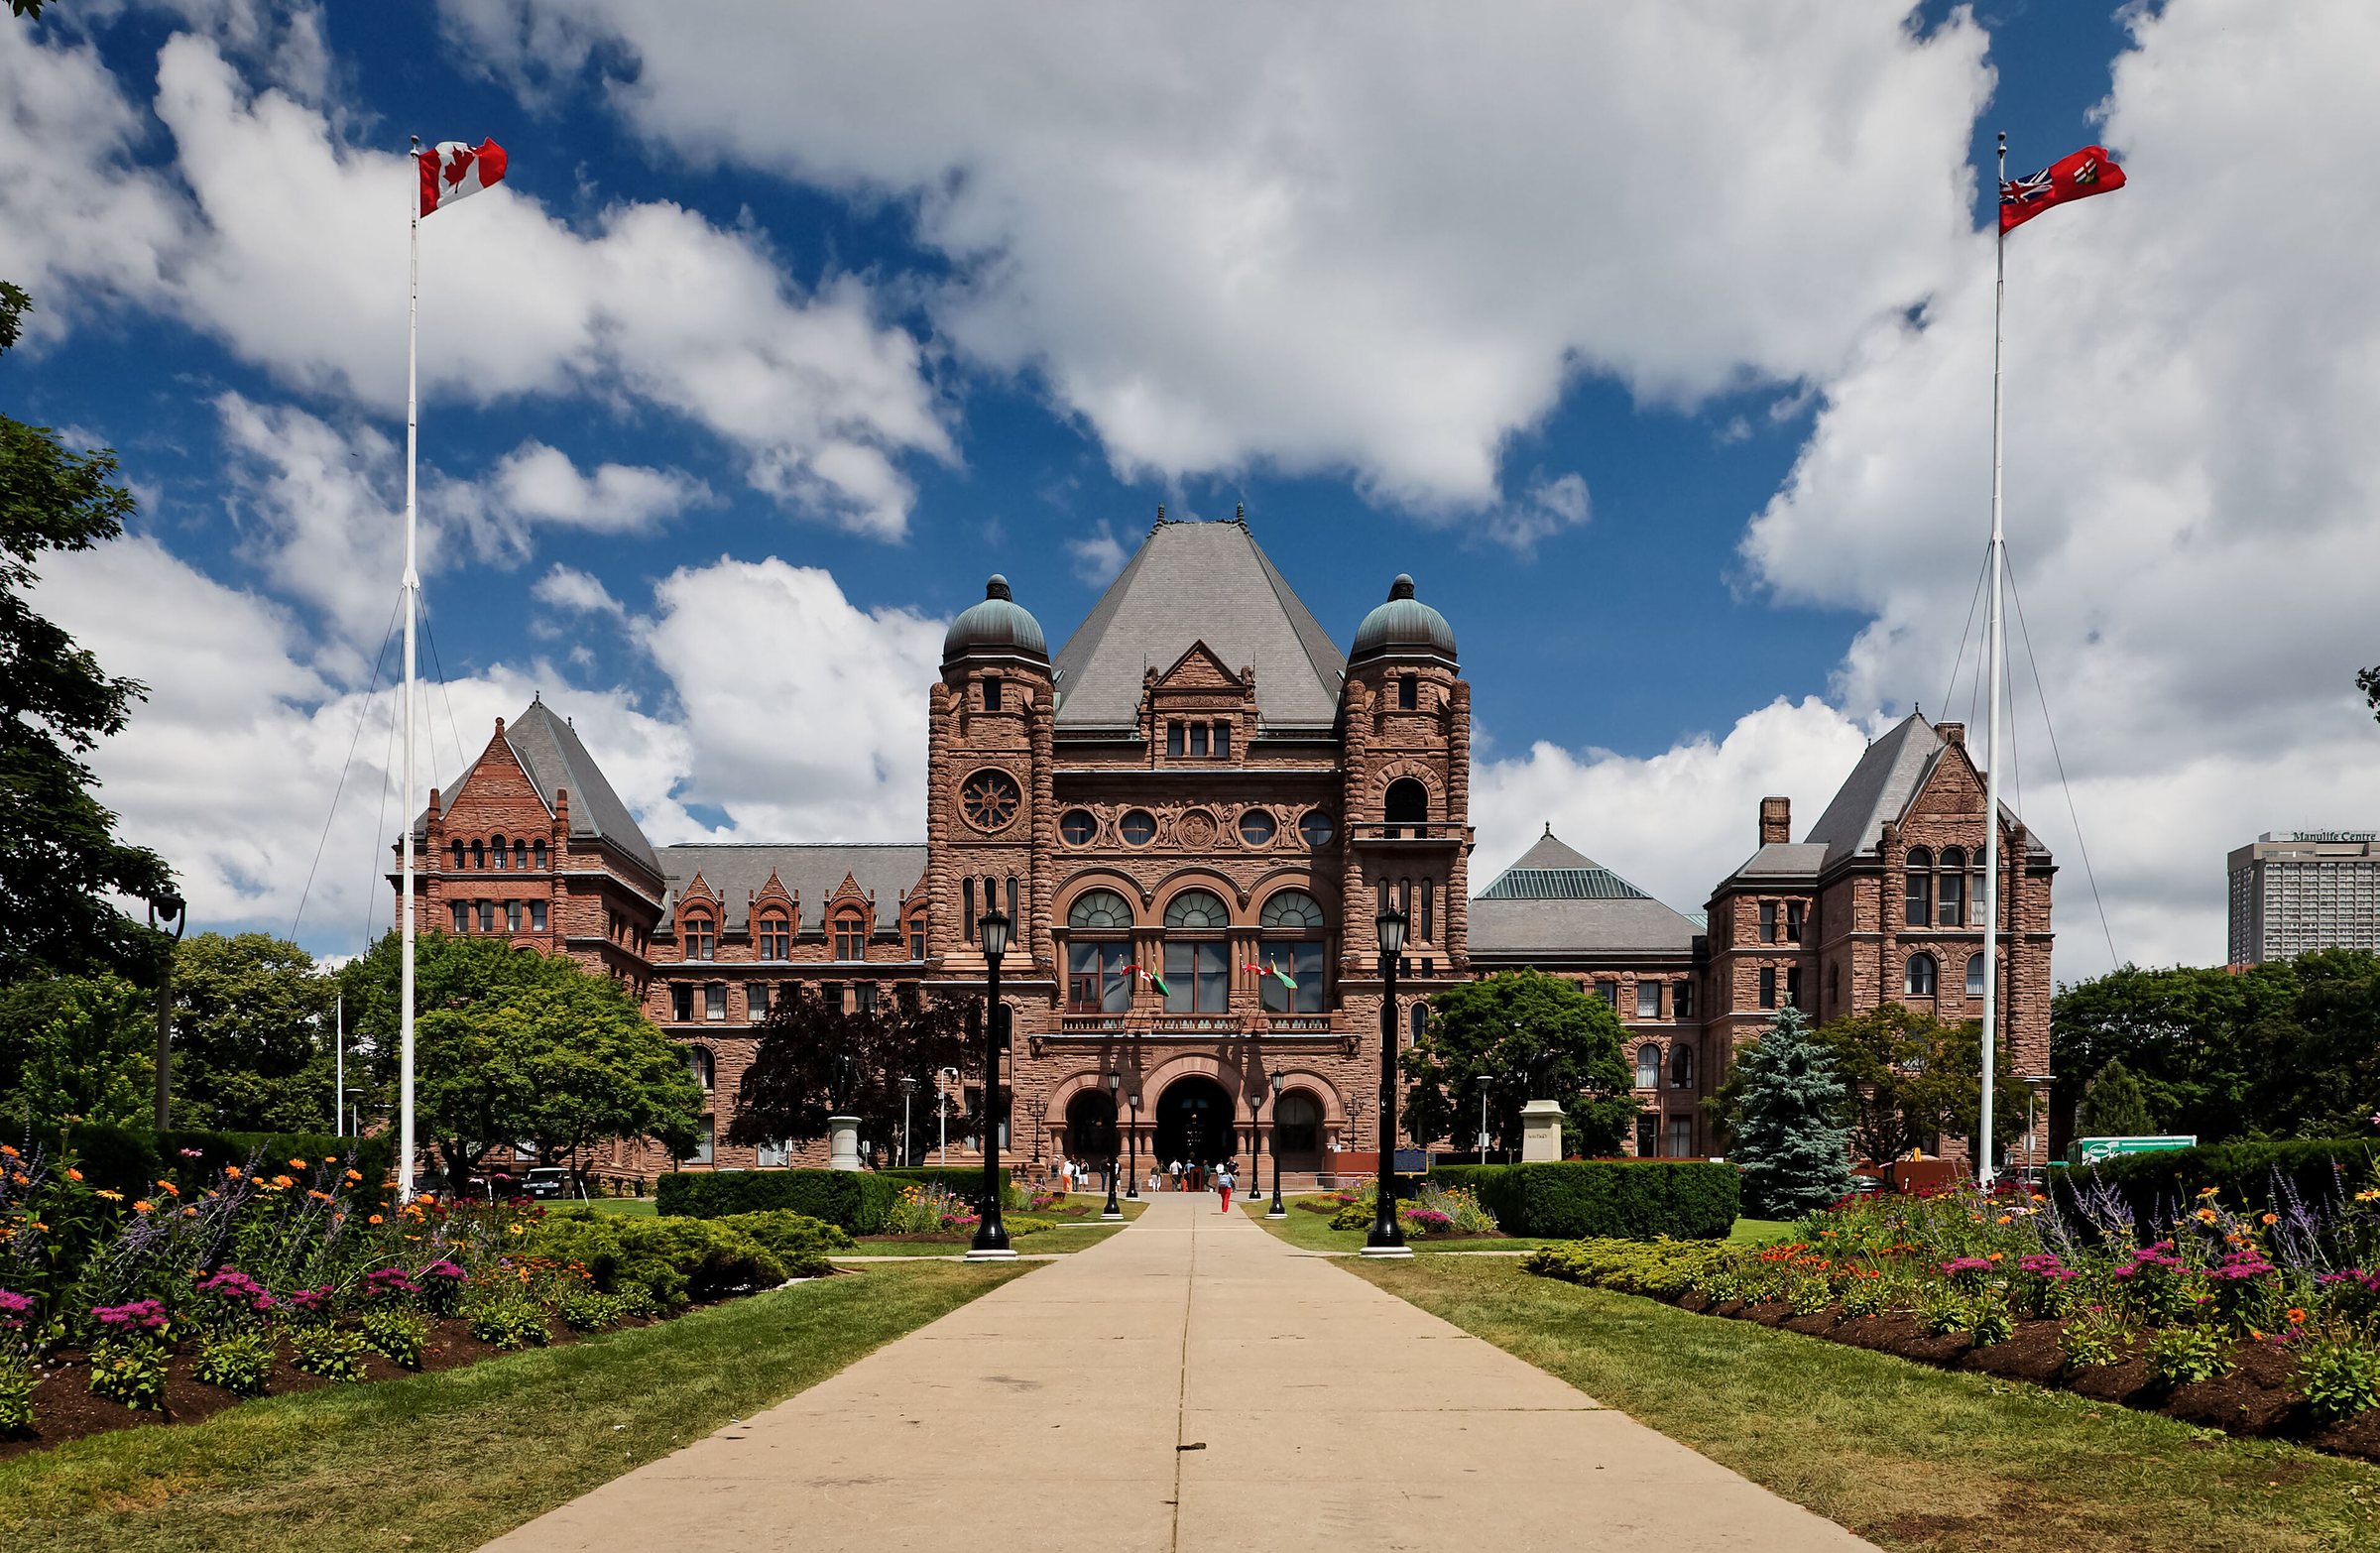
The Ontario Legislative Building at Queen’s Park, Toronto. O. Reg. 493/17, the province’s Food Premises regulation, is made under the Health Protection and Promotion Act. Photo: Benson Kua, CC BY-SA 2.0, via Wikimedia Commons.

Ontario, on paper

Ontario’s Food Premises regulation, O. Reg. 493/17, defines a “food service premise” as any food premise where meals or meal portions are prepared for immediate consumption. The definition is agnostic to who, or what, does the preparing.1 A “food handler,” by contrast, is defined only as a person; the regulation contemplates no machine substitute.1 Vending machines appear in the text as a species of equipment, not as an alternative premises class.1

Two sections then pull in opposite directions. Section 17, an equipment-sanitation rule, plainly contemplates lawful unattended operation: a machine that auto-mixes water needs a piped potable supply, and the operator’s name and phone number must be posted “if an employee of the operator is not in full-time attendance.”1

Section 32 requires that every operator of a food service premise keep at least one trained food handler or supervisor on the premise “during every hour in which the premise is operating.”1 A fresh drink blended from dairy and frozen fruit is a time-and-temperature-controlled food, which forecloses the regulation’s low-risk exemption on its face.1

The classification question, drawn: one regulation, two sections, two outcomes.
An unattended fresh-drink kioskdairy and frozen fruit, blended to orderWhich is it, under O. Reg. 493/17?the regulation’s text does not resolve itA food service premises. 1: meals or meal portions prepared forimmediate consumption; agnostic to who,or what, does the preparingSection 32 appliesa trained food handler or supervisor onthe premise during every operating hourCriterion K7: a format kill forfresh drinks at this siteEquipment inside a premisevending machines appear in the text asequipment, not as a premises classSection 17 appliespiped potable water if it auto-mixes water;operator’s name and phone postedLawful unattended operation,as section 17 contemplatess. 3.1low-riskexemptionforeclosedA fresh drink blended from dairy and frozen fruit is time-and-temperature-controlled food: s. 3.1 does not reach it.
Figure 4.1O. Reg. 493/17 read against the kiosk. The text does not say which branch applies; this study assumes Ontario’s text will be enforced as written.O. Reg. 493/17, ss. 1, 3.1, 17 and 32; Ontario Ministry of Health, Food Premises Reference Document (2019), p. 18. Notes 1 and 2.

So the classification question is exact: is the kiosk a food service premise, which section 32 staffs; or equipment inside a premise, which section 17 sanitizes? The regulation’s text does not resolve it. The Ministry’s own reference document acknowledges that many vending machines “operate automatically without employee assistance” while affirming that all other duties still apply, and leaves section 32 untouched.2

Toronto, in practice

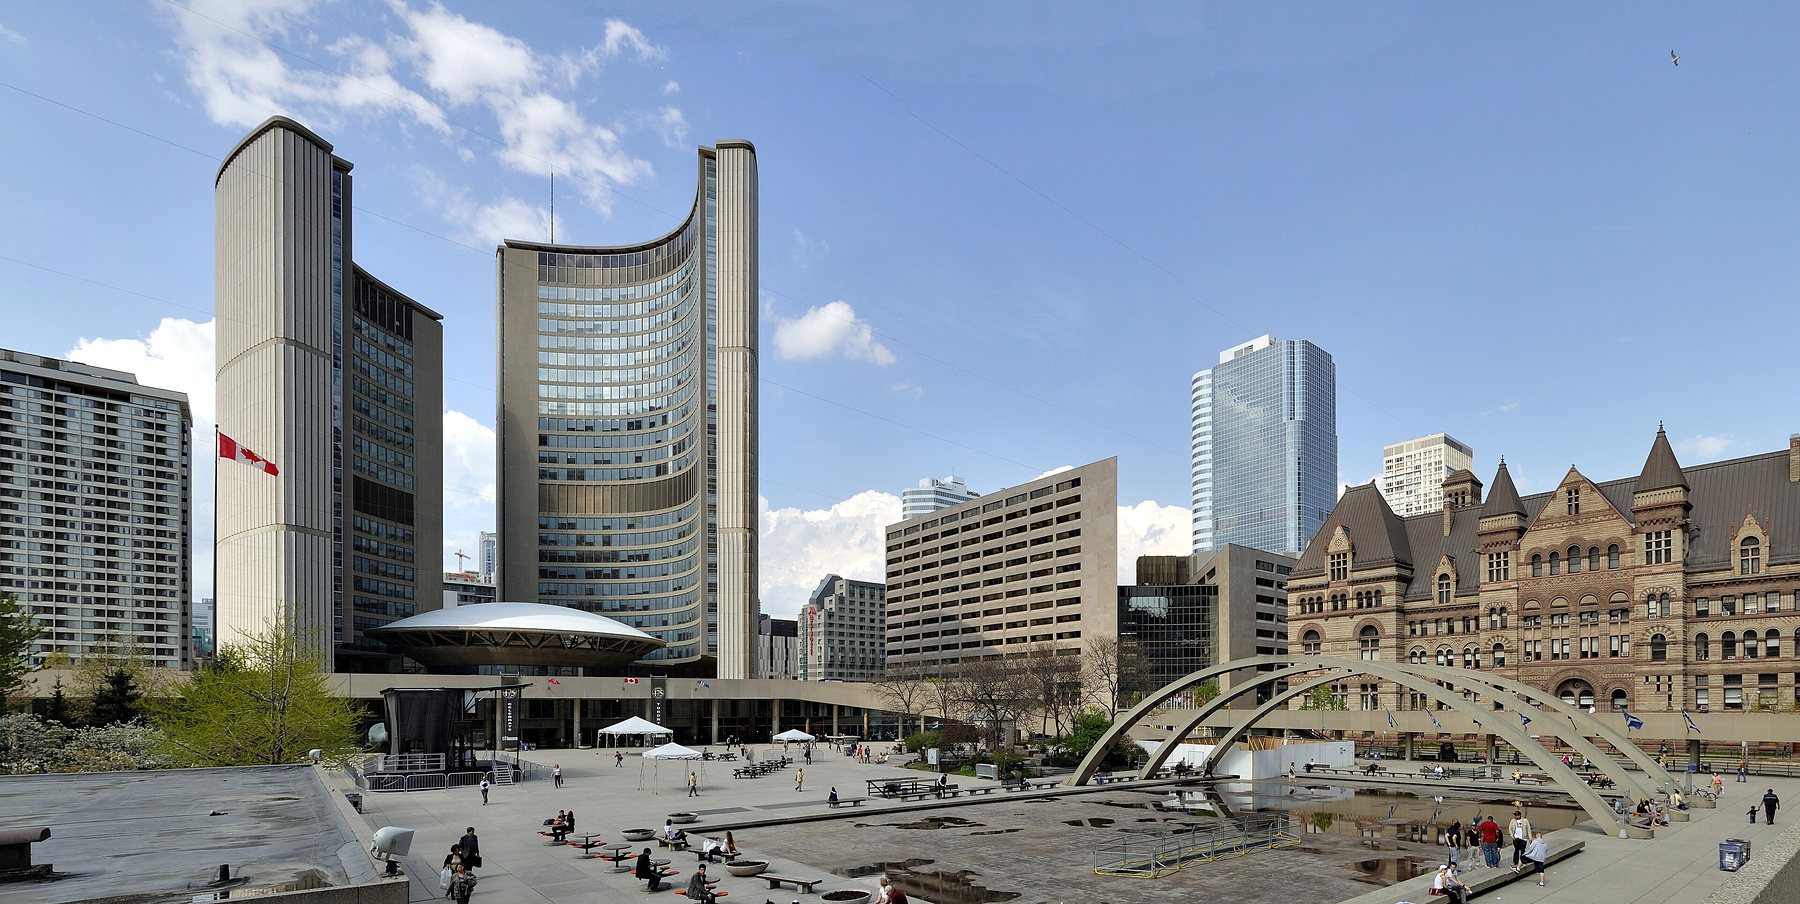
Toronto City Hall, two curved towers around a domed council chamber, with Nathan Phillips Square in front
Figure 4.2Toronto City Hall and Nathan Phillips Square. The DineSafe dataset is the City of Toronto’s own open data.Photo: Taxiarchos228, CC BY 3.0, via Wikimedia Commons.

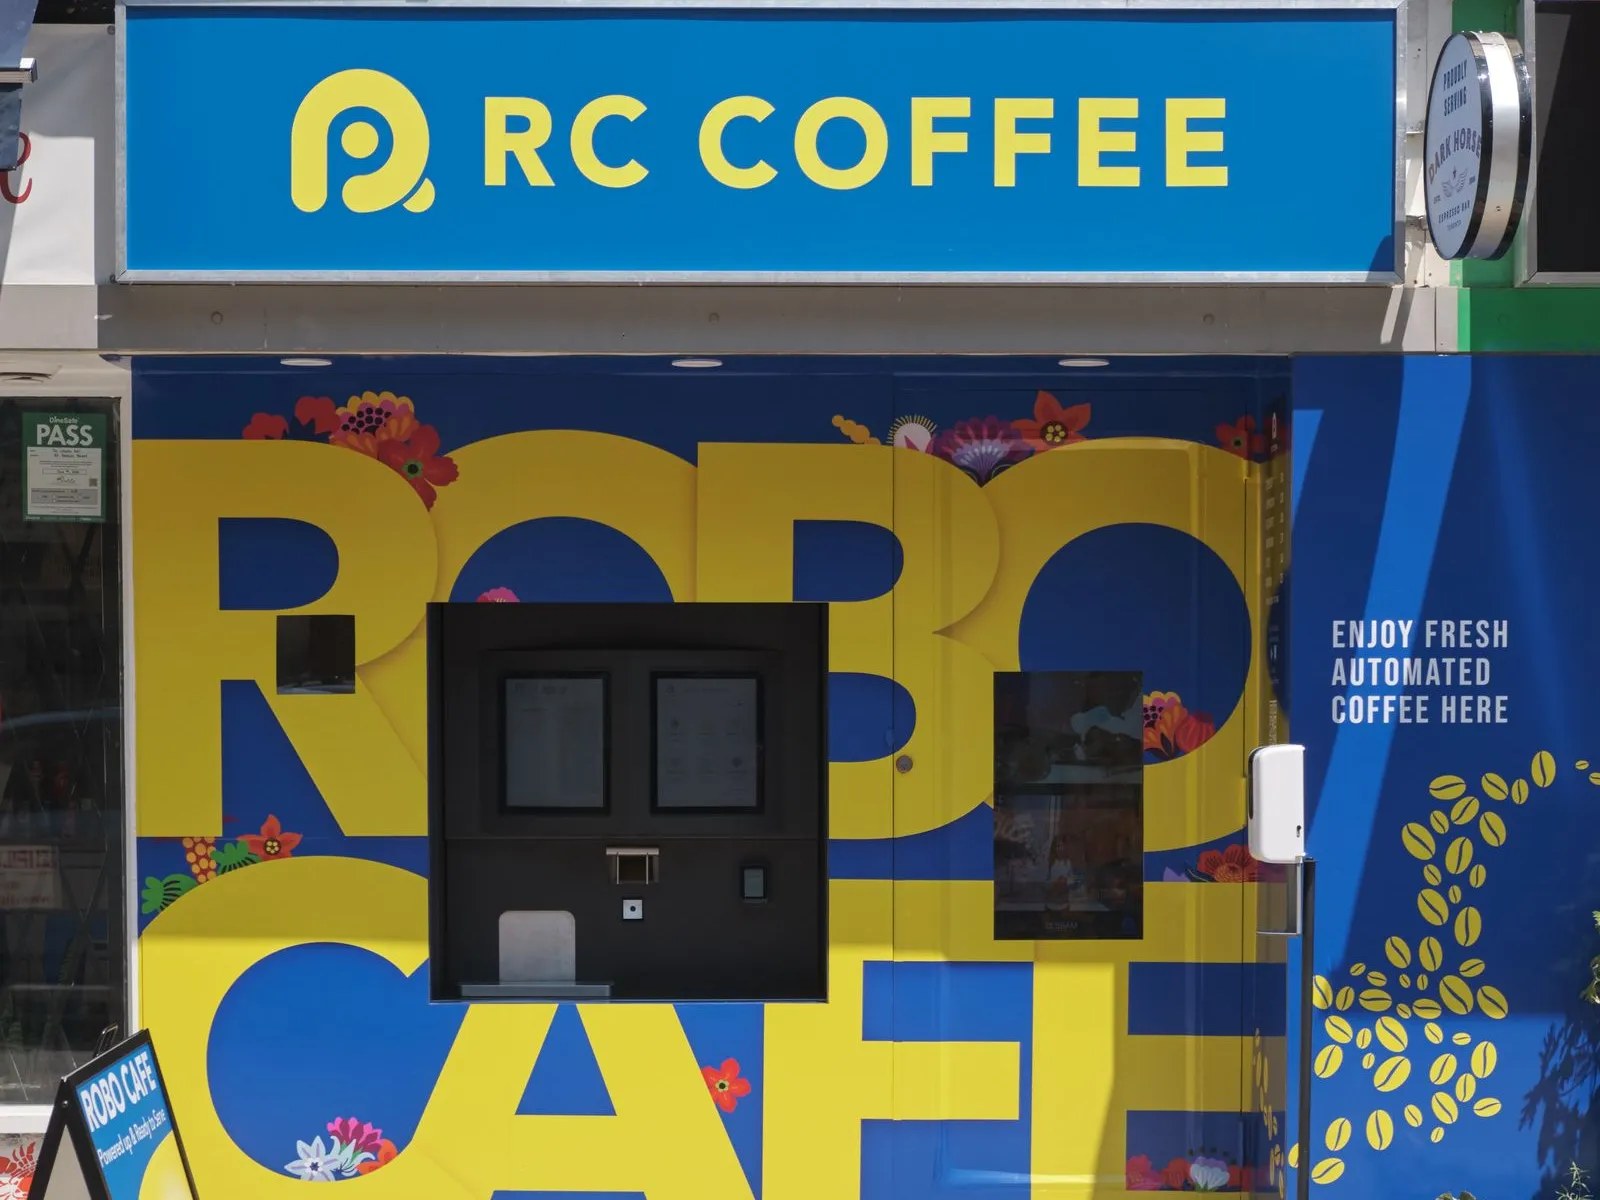
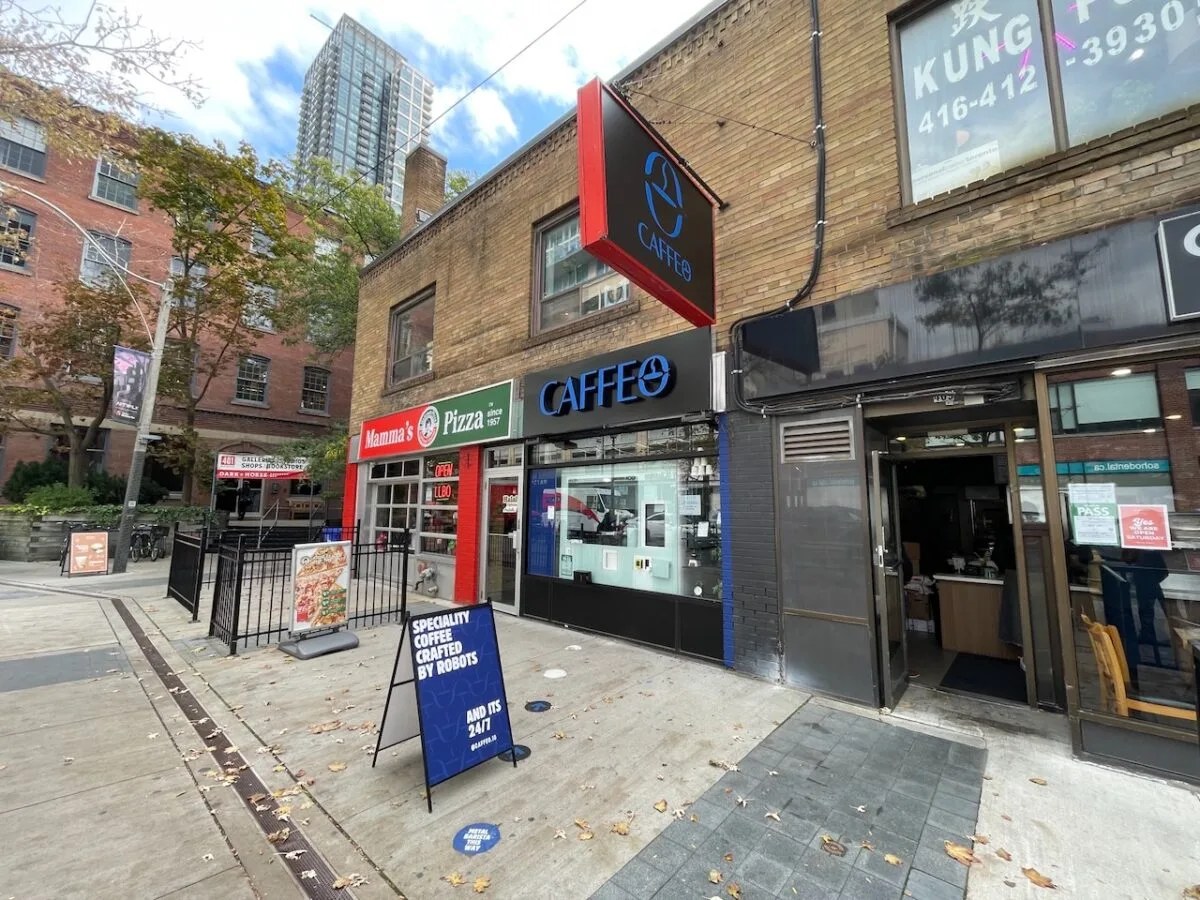
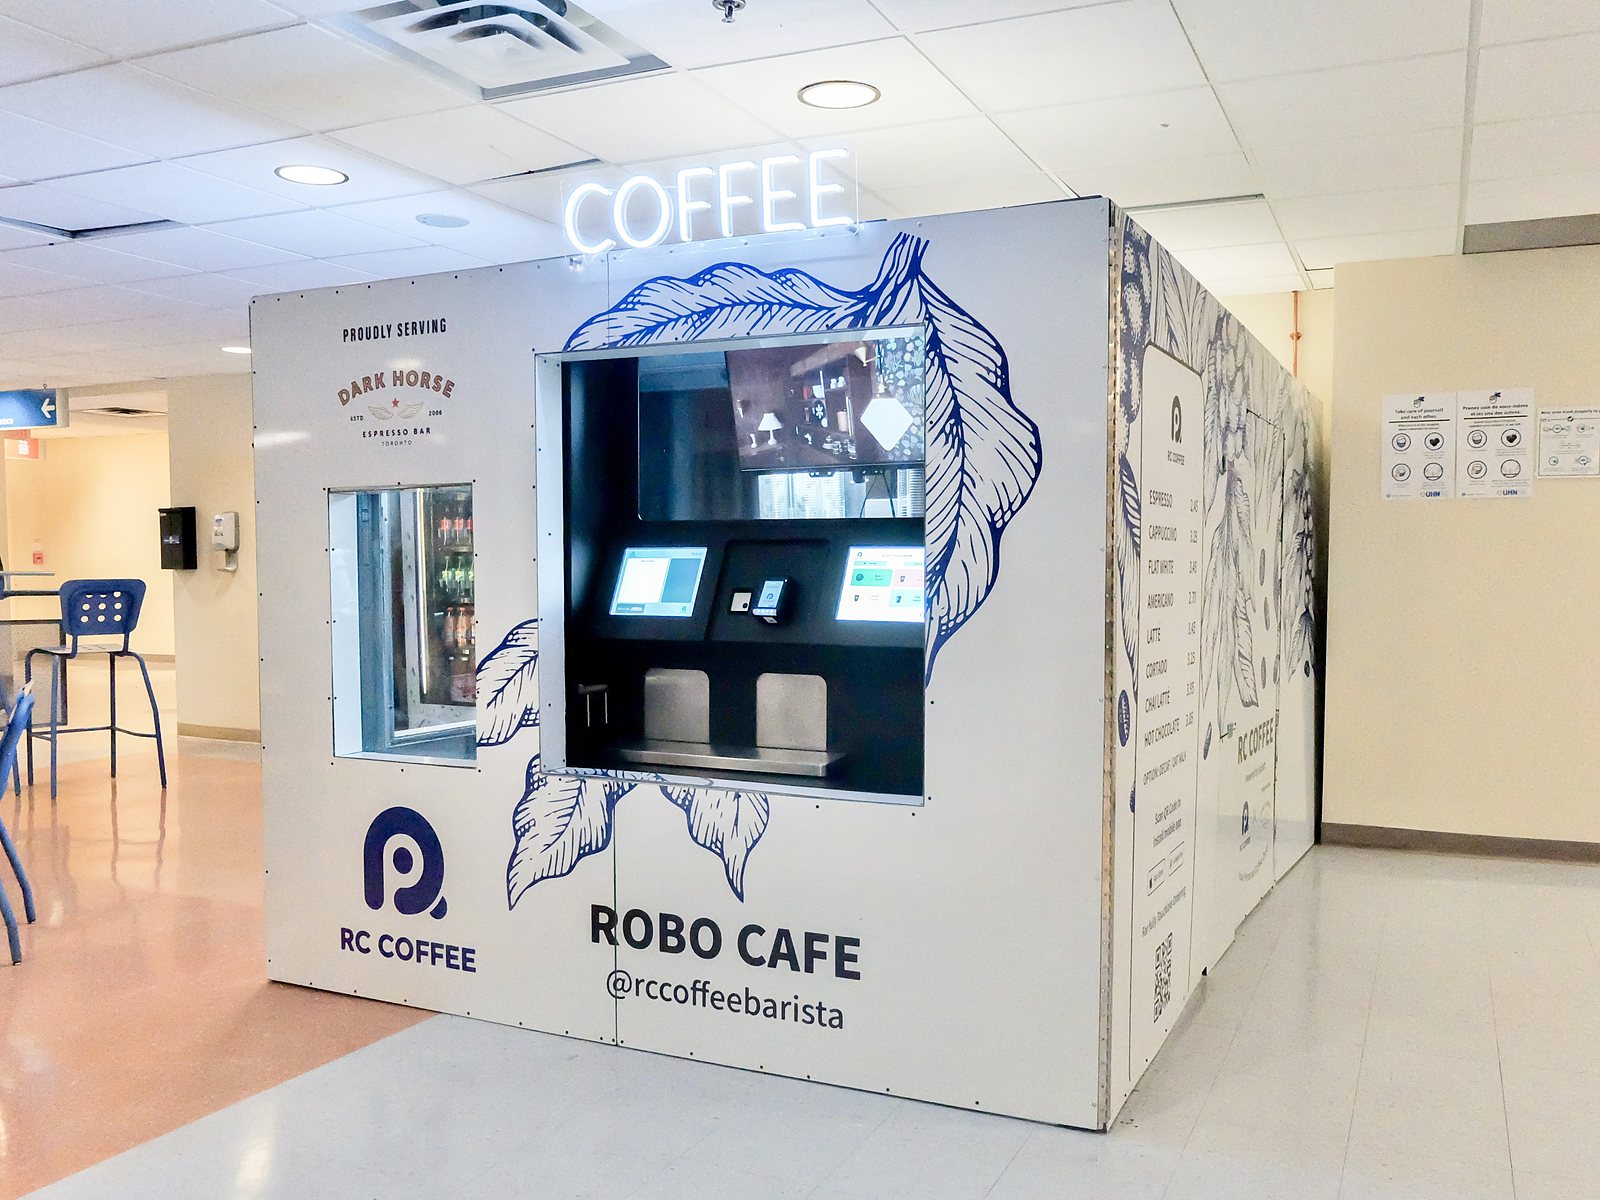
Toronto’s DineSafe open dataset held 104,790 inspection records at access.3 RC Coffee has operated unattended robotic espresso kiosks, fresh dairy and cashless, since 2020, and under its own Robo Cafe brand since June 2021. It listed twelve or more locations at access, major hospitals among them. The dataset holds no record of it under any searchable name.3 Caffeo, a directly comparable unattended fresh-dairy espresso kiosk that opened in September 2025, is listed, and passed a Food Premises inspection on 2025-09-12.3 The same city treats the same class of operation both ways; Toronto’s enforcement of the category is unsettled.

Two cities’ own food records: two of the unattended operators are missing from them, one is listed, and the conventional vendors beside them appear as usual.
Toronto · DineSafe open data, 104,790 records
RC Coffeeunattended robotic espresso · fresh dairy · since 2020 · 12+ locations0 recordsacross nearly 6 years of operation
Caffeosame class of operation · opened September 2025listed · passedFood Premises inspection, 2025-09-12
Chicago · food inspections + business licenses, 26 logged queries
Zenblensmoothie kiosks · fresh dairy · queried at all 9 venue addresses, 2021 to 20260 recordsboth datasets, every spelling variant
Co-located food vendorscafés, a chain bakery, campus dining, the vending contractor, same addresseslicensed · inspectedindividually listed in the same datasets
Figure 4.3Two jurisdictions’ own open data, queried directly; methods in the notes. The datasets are not blind: the co-located, conventional food vendors at the same addresses appear normally. One downtown “shared kitchen user” license exists for the category leader, at an address unconnected to any venue, renewed through January 2027.City of Toronto DineSafe open dataset; City of Chicago Food Inspections (4ijn-s7e5) and Business Licenses (r5kz-chrr) via the Socrata API, 26 logged queries, accessed 2026-07-14.
RC Coffee Robo Cafe storefront on a Toronto sidewalk, an automated espresso kiosk set into a blue and yellow wall
Caffeo storefront on Richmond Street West with a sandwich board reading speciality coffee crafted by robots
Figure 4.4The two Toronto operators of the comparison. Left: RC Coffee’s Robo Cafe at its 2021 launch, the unattended fresh-dairy kiosk with no DineSafe record under any searchable name; a DineSafe placard is visible in the neighbouring storefront’s window. Right: Caffeo at 405 Richmond Street West, the directly comparable kiosk that is listed, and passed a Food Premises inspection on 2025-09-12.Photos: RC Coffee / TechTrex via Newsfile (press release); Dustin Fuhs, 6ix Retail.

Chicago, in practice

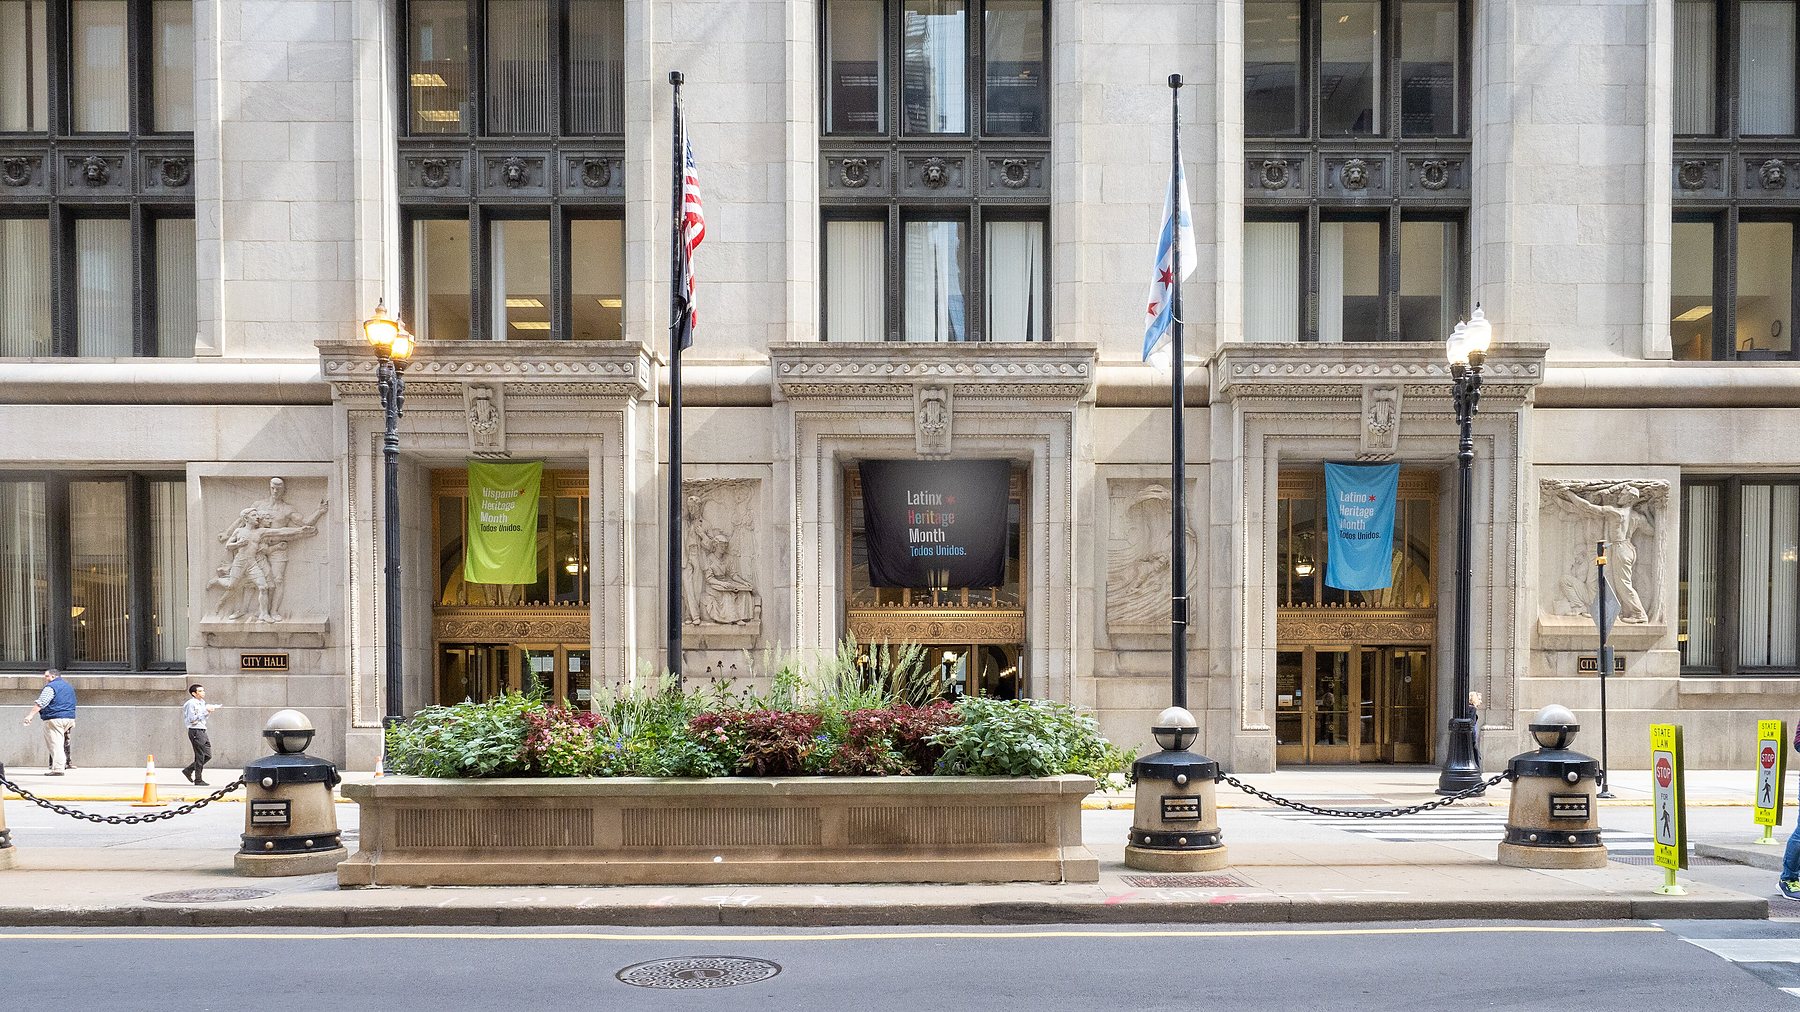
The classical granite entrance of Chicago City Hall on LaSalle Street, with flags and planters
Figure 4.5Chicago City Hall on LaSalle Street. The city’s code routes automatic food vending through a retail-food-establishment license.Photo: ajay_suresh, CC BY 2.0, via Wikimedia Commons.

Chicago’s municipal code anticipates this exact business model. Section 4-8-032 defines an automatic-food-vending-machine operation and routes it through a retail-food-establishment license, with health-department approval of the machine type and inspection of the commissary and servicing facilities.4 On paper, an operator’s dispensing locations carry licenses.

Queried directly through the city’s open-data API, across both the food-inspections and business-licenses datasets, at all nine of Zenblen’s Chicago venue addresses and over multiple spelling variants: zero records.5 The datasets are not blind at those addresses; the same queries return the co-located food operators, from campus dining and a chain bakery to the vending contractor’s own micro-markets, individually licensed and inspected.5

One Zenblen license does exist: a shared-kitchen-user license at a downtown address unconnected to any venue, renewed through January 2027.5 After five years of operation there is no dispensing-location record, though the code requires one.

Illinois’ statutory language is also softer than Ontario’s. The state food-handling act requires food service establishments to be under a certified manager’s “operational supervision,” wording that plausibly permits one manager across several unattended sites; Ontario’s section 32 says a person on the premise, every operating hour.6 The federal model code’s own working group put the strict reading plainly: an unattended operation selling anything beyond prepackaged, non-hazardous food “would be required to have a person-in-charge at all hours of operation.”7

The finding is regulatory lag, not wrongdoing: enforcement practice in two large cities has not caught up to a category their own codes already describe.

Neither city’s practice is evidence that Ontario’s stricter text will not be applied in Ontario; Toronto has already inspected one unattended kiosk. The study therefore assumes Ontario’s text will be enforced as written.

Notes

  1. O. Reg. 493/17 (Food Premises), under the Health Protection and Promotion Act: s.1 definitions, s.3.1 exemption, s.17, s.32. ontario.ca/laws/regulation/170493 and canlii.org, accessed 2026-07-14. Statutory text cross-checked two ways (rendered e-Laws fetch; text extraction of the Ministry reference document, which reproduces the definitions verbatim).
  2. Ontario Ministry of Health, Food Premises Reference Document (2019), p. 18, on s.17, accessed 2026-07-14.
  3. City of Toronto DineSafe open dataset, 104,790 records at access, parsed directly, 2026-07-14. RC Coffee locations per rccoffee.com, accessed 2026-07-14; its first kiosk per a Newsfile release of 2020-10-07. RC Coffee searched again on 2026-10-02 in the current dataset and the historical files for 2001 to 2023: no record. Caffeo (405 Richmond St W) inspection pass dated 2025-09-12 in the same dataset.
  4. Chicago Municipal Code §4-8-032 (automatic food vending machine operations, licensed through retail food establishments), accessed via the code’s indexed text, 2026-07-14.
  5. City of Chicago open data via the Socrata API: Food Inspections dataset 4ijn-s7e5 and Business Licenses dataset r5kz-chrr; 26 queries with full raw responses archived, 2026-07-14. Co-located examples include license 2796844 (chain bakery at a hospital address) and licenses 2877822 and 2882530 (the vending contractor’s café and micro-market at a hospital tower). The shared-kitchen-user license is 2762826, current renewal expiring 2027-01-15.
  6. 410 ILCS 625/3 (Food Handling Regulation Enforcement Act), ilga.gov, accessed 2026-07-14. Illinois adopts the FDA Food Code (2022) as the Illinois Food Code, dph.illinois.gov, accessed 2026-07-14.
  7. Conference for Food Protection, “Unattended Food Establishments” issue paper (2014 packet), foodprotect.org, accessed 2026-07-14.
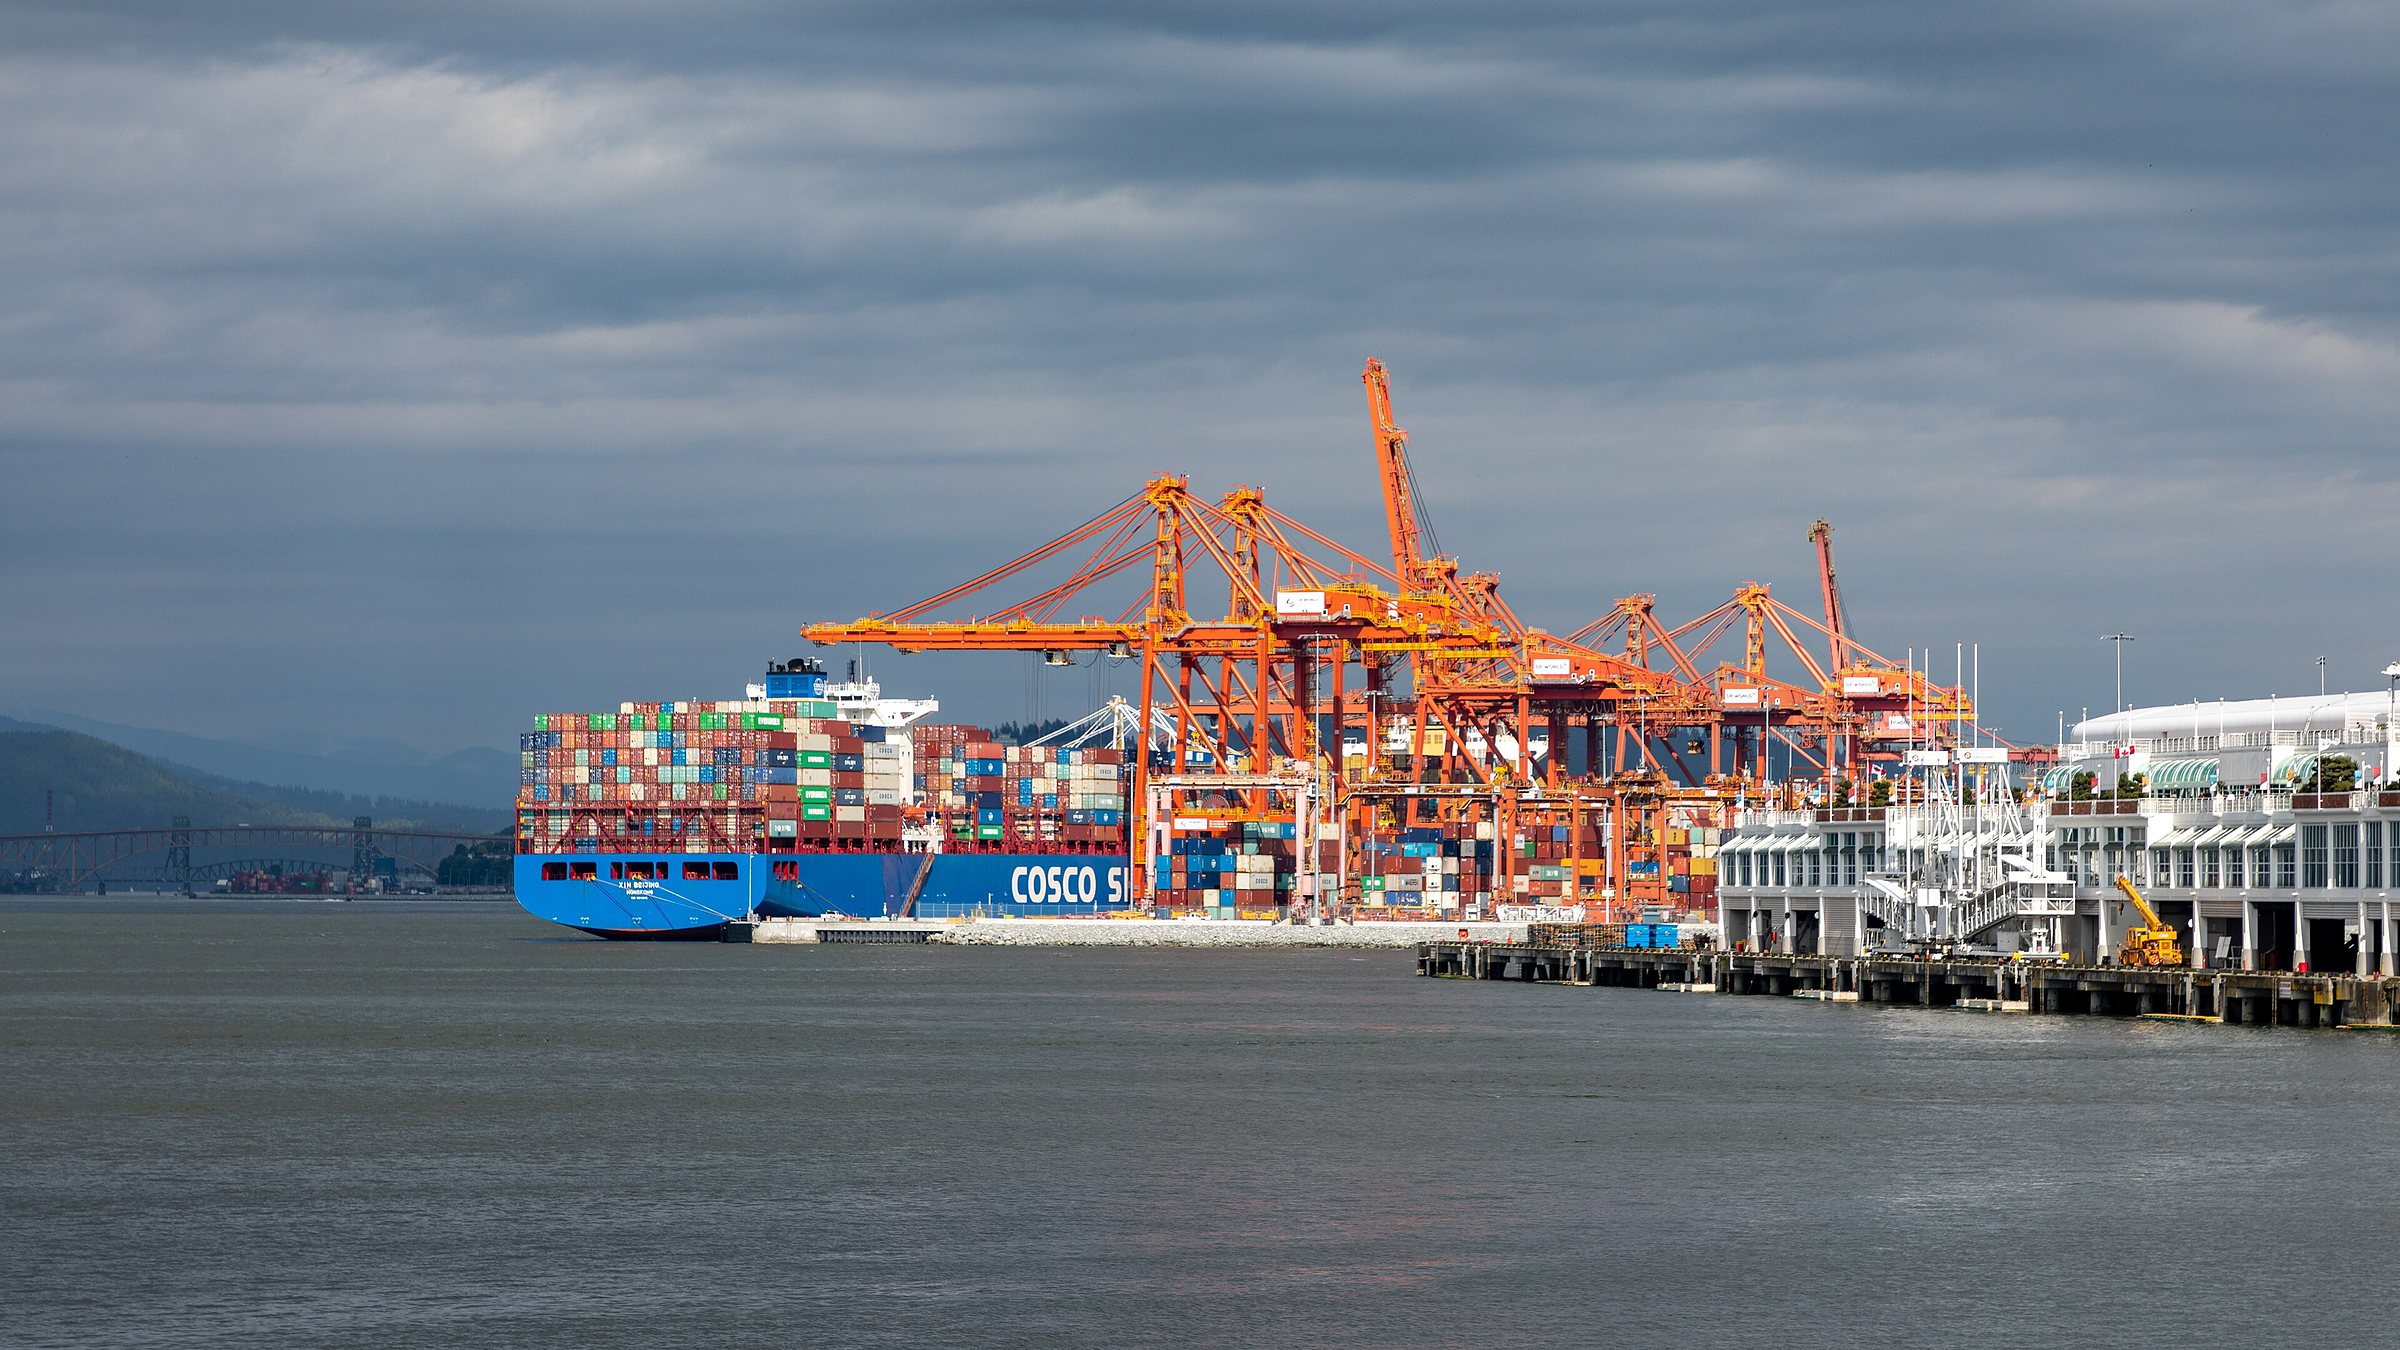
Orange container cranes and a loaded container ship at the Centerm terminal in Vancouver harbour

Chapter 05

Automation assessment

The machine question entered the study as a prediction: a doctrine-compliant drink robot exists at or under $20,000 CAD landed. The research falsified it.

In this chapter

  1. 5.1The landed-cost arithmetic
  2. 5.2The payment filter
  3. 5.3The component build
  4. 5.4Reliability is the bar

At a glance

$26.5–28.4K
a robot-arm machine, landed in Ontario, CAD
30–40%
the understatement in the sticker
4–6 months
from purchase order to legally operable

Container cranes at the Centerm terminal, Port of Vancouver, 2022. A machine priced free-on-board overseas still carries ocean freight, duty, tax, brokerage and an electrical field evaluation before it can legally operate in Ontario. Photo: Dietmar Rabich, CC BY-SA 4.0, via Wikimedia Commons.

The landed-cost arithmetic

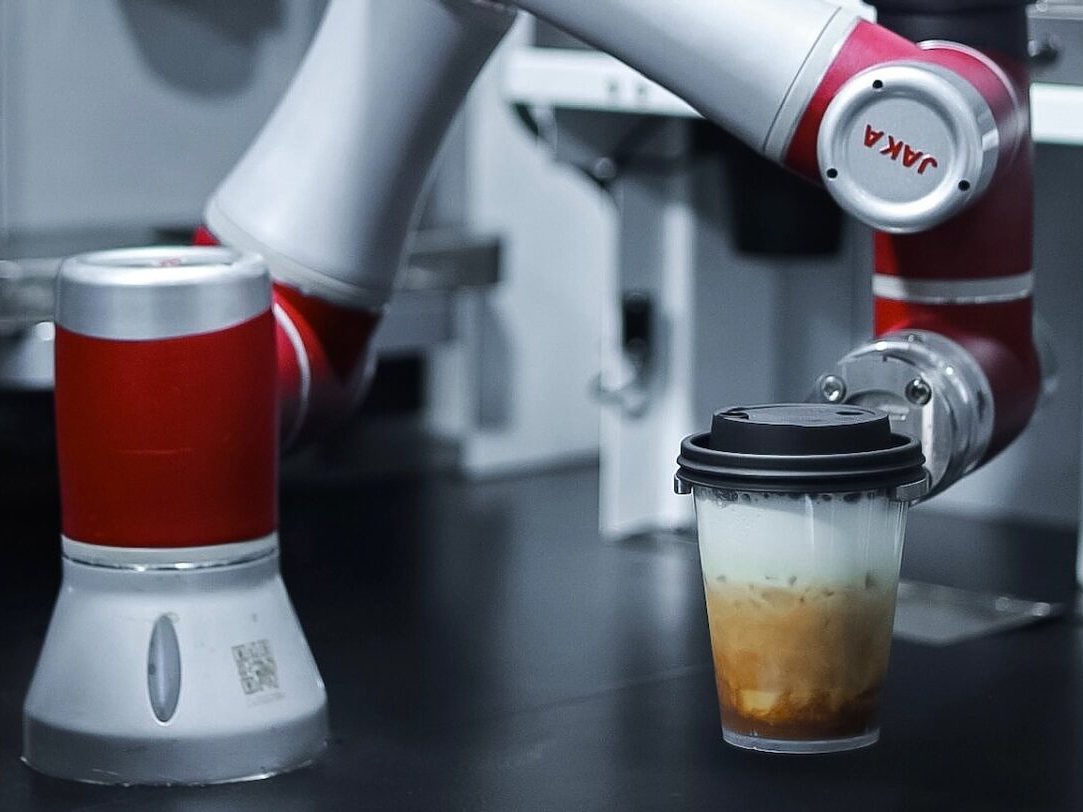
Robot-arm bubble-tea machines list on overseas marketplaces at US$12,800 to $15,900, which converts to roughly $18,000 to $22,500 CAD and appears to clear the ceiling.1 Landed, it does not.

A worked mid-range example at US$14,350 free-on-board becomes $20,305 CAD before the boat: ocean freight adds $600 to $1,500, import duty adds zero to about $1,700 depending on an unresolved tariff-heading question, tax and brokerage add about $1,300, and none of the researched Chinese units carries a Canadian electrical approval, so an Electrical Safety Authority field evaluation adds an estimated $2,000 to $6,000 more.2 The full landed range is roughly $26,500 to $28,400 CAD, a 30 to 40 percent understatement in the sticker, and four to six months from purchase order to legally operable is the realistic timeline.2

The machine cost ladder, cheapest to dearest. Only the component build lands compliant under the $20K ceiling.
0k10k20k30k40k50k60klanded cost, CADDIY component buildNSF-certified parts, hardware onlyDIY component build: $8.4–20.0k$8.4–20.0kSmoothie OEM, stickerUS$9,500 FOB · certification gap unresolvedSmoothie OEM, sticker: $13.4k$13.4kRobot-arm OEM, stickerUS$12,800–15,900 · what the listing impliesRobot-arm OEM, sticker: $18.1–22.5k$18.1–22.5kCredentialed blender, outrightUS$14,999 · not a bubble-tea machineCredentialed blender, outright: $21.2k$21.2kRobot-arm OEM, landed+ freight, duty, GST, brokerage, field evalRobot-arm OEM, landed: $26.5–28.4k$26.5–28.4kCredentialed platform tierplatform + tapioca module + enclosureCredentialed platform tier: $30.0–60.0k$30.0–60.0kElevator-style OEM, stickerUS$26,800–28,800 · landed not modelledElevator-style OEM, sticker: $37.9–40.8k$37.9–40.8kthe $20K kill ceiling
Figure 5.1Sticker rungs are what listings imply; the landed rung is what a unit costs in Ontario, legally operable. The dashed line is the study’s $20K kill threshold (criterion K2).Vendor listings and worked landed-cost example, prices researched 2026-07-13/14, FX 1 USD = 1.415 CAD; full source list in Appendix B.
From sticker to legally operable: what the listing leaves out.
THE FACTORY GATELEGALLY OPERABLE IN ONTARIO1Sticker, FOB$20,305US$14,350 at1.4152Ocean freight+ $600–1,500LCL, $80–200per cubic metre3Import duty+ $0–1,700tariff headingunresolved4GST, brokerage+ about $1,3005% GST on theduty-paid value5Field evaluation+ $2,000–6,000estimated; noCanadian approval6Landed$26.5–28.4Klegally operablein Ontariofour to six months from purchase order; the sticker understates the landed cost by 30 to 40 percentCAD unless marked. The landed range is the study’s worked estimate, not the sum of the extremes.
Figure 5.2The robot-arm rung of the ladder, opened up: the worked mid-range example above, one cost at a time. The listing prices the machine at the factory gate; four costs and four to six months stand between that price and a unit legally operable in Ontario.Worked landed-cost example, note 2; FX 1 USD = 1.415 CAD (note 1).

The payment filter

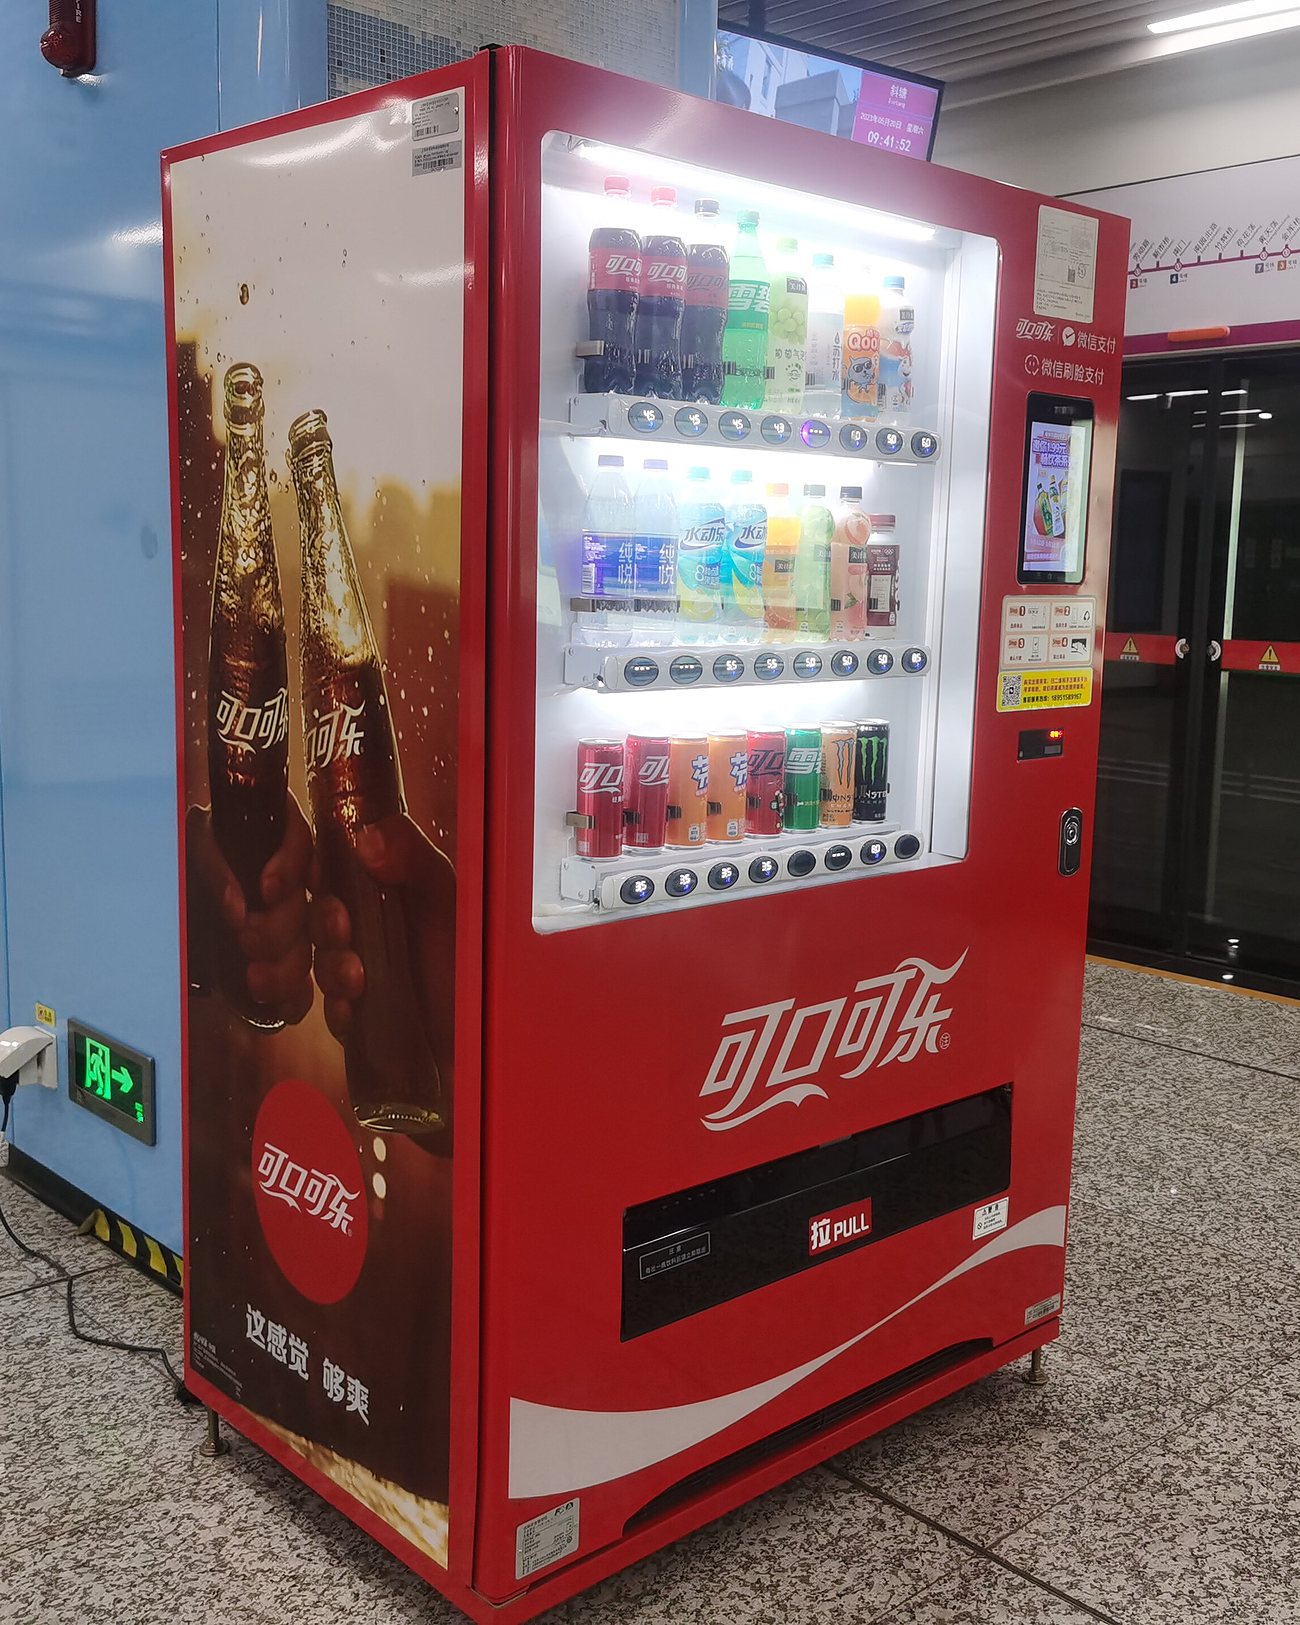
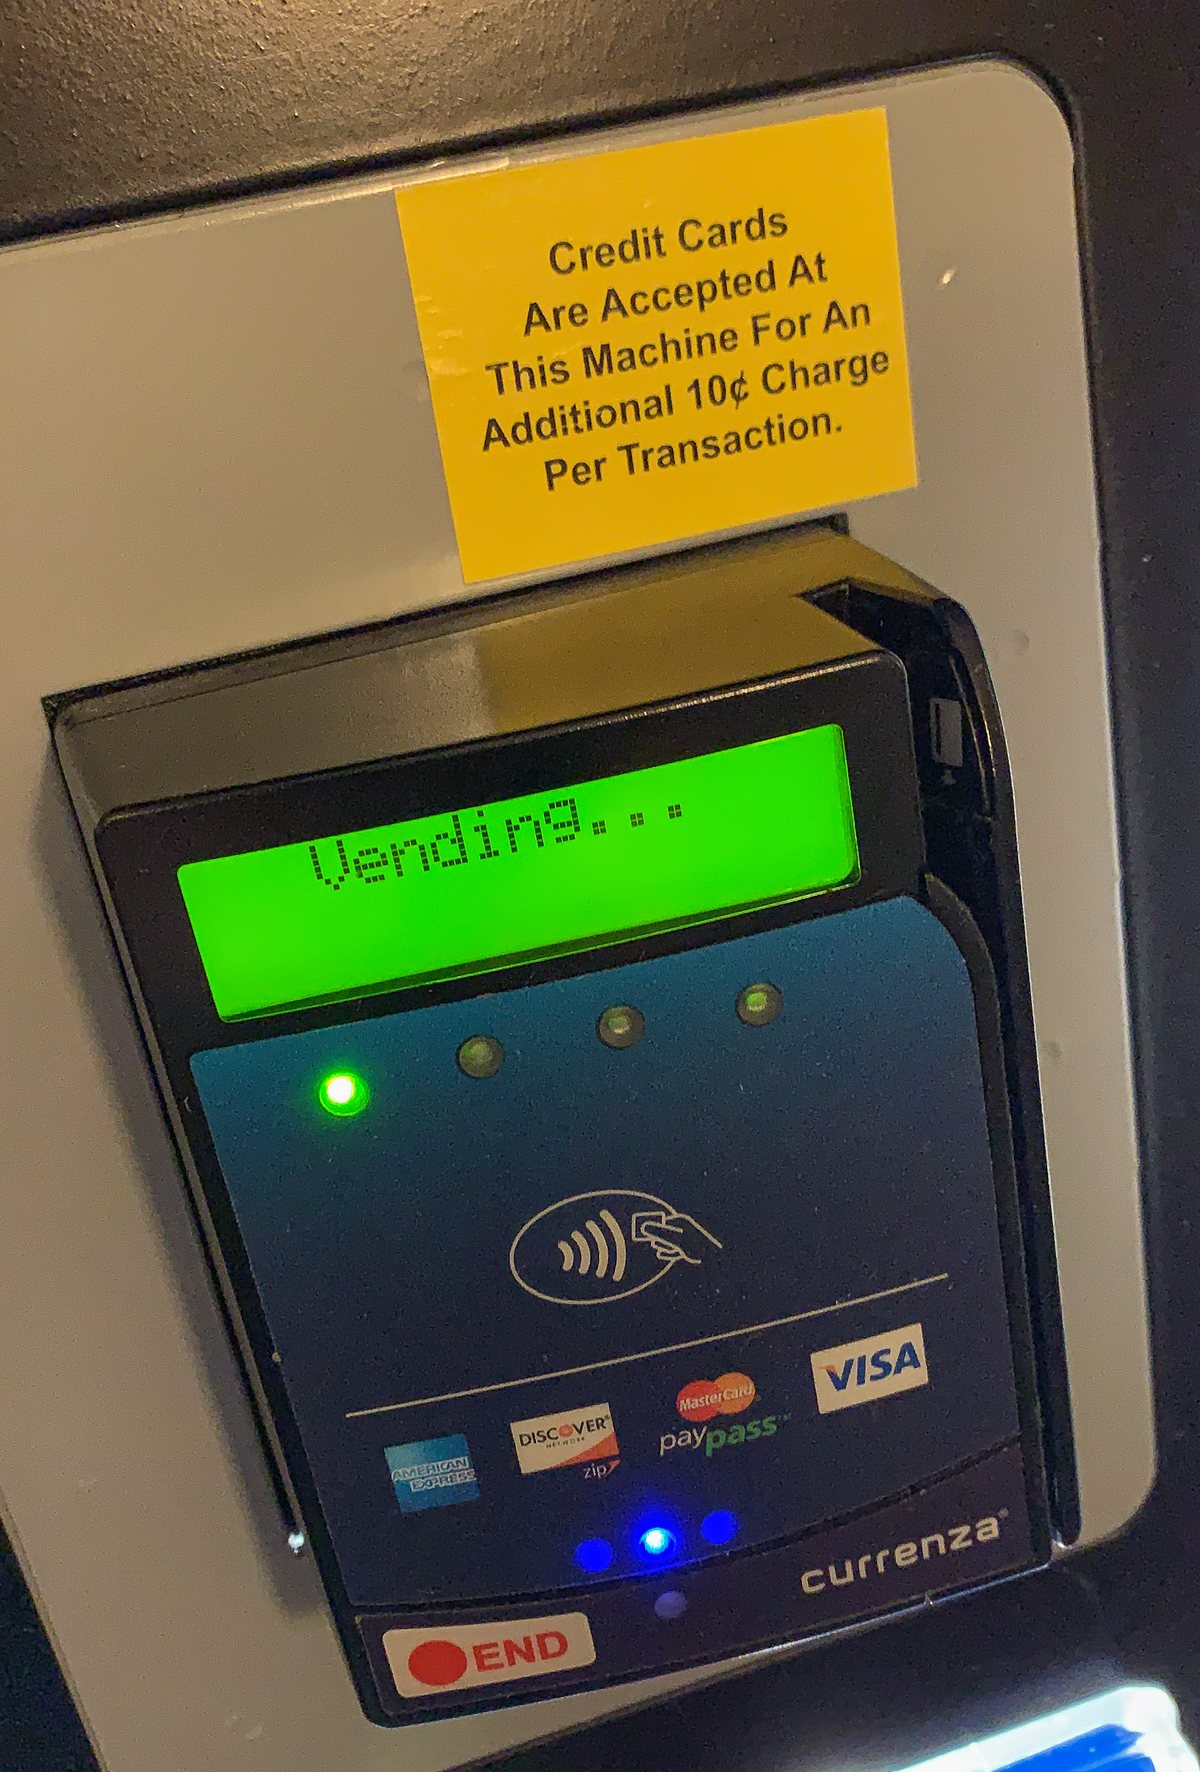
Before price, one binary filter: who is the merchant of record. The studio’s standing rule is that the operator owns the payment flow. Most overseas vending hardware is built for sealed domestic payment rails and bakes the reader into the machine; there is no legitimate way to intercept a sealed proprietary payment path without the vendor’s cooperation.3

The compliant integration shape is a documented bus or dispense-trigger interface, the way third-party vending processors integrate.3 Of everything researched, exactly one vendor claims third-party point-of-sale openness in its marketing, unverified; the rest are unconfirmed or lean toward sealed.1 A component-level build passes the filter by construction: every interface in it is the operator’s own.

The payment filter, in two machines.
A red Coca-Cola vending machine on a metro platform in Suzhou, a payment panel built into its side
A retrofitted card reader on a vending machine, its display reading Vending, under a sticker about a ten-cent card charge
Figure 5.3Left: a Coca-Cola vending machine at Xietang Station, Suzhou, China, its reader built into the cabinet, the shape most overseas hardware takes. Right: a third-party card and mobile-payment reader fitted to a soda machine, the documented-interface path third-party vending processors use.Photos: left, Shwangtianyuan, CC BY-SA 4.0; right, Tony Webster, CC BY 2.0; both via Wikimedia Commons.

The component build

The reference design prices a fresh-drink machine as a set of individually certified commercial food-service parts: merchandiser fridge, chest freezer, food-grade dosing pumps, a hot-hold unit, a cup sealer, stainless prep surfaces, an enclosure, and the actuation electronics an edge computer drives directly. Hardware totals roughly $8,400 to $20,000 CAD, midpoint near $14,000.4

Beyond price, the build carries two structural advantages: its parts already hold recognized food-equipment certifications individually, a materially cleaner compliance story than a sealed imported box with none; and its integration surface is plain relays and drivers rather than a vendor protocol to reverse-engineer.4

The component build as one machine: certified parts, the operator’s own interfaces.
Edge computerthe store’s ownActuation electronicsplain relays and driverscontrolFOOD-ZONE ENCLOSUREKEEPDOSETHE CUPMerchandiser fridgedairy, perishablesChest freezerIQF fruitHot-hold unittapiocaPeristaltic pumps × 4food-gradeIQF dosing mechanismcustom: the least matureDiaphragm pumppuréeCup dispenserThe cup, filledat the dosing stationCup sealerfillWater line-in and drain fittingsstainless NSF prep tables × 2 carry the workNo ice machinechilled, not iced, by design
Figure 5.4The subsystems of the reference design, grouped by the job each does. The edge computer drives the actuation electronics directly, through plain relays and drivers. In blue, the least mature line: the frozen-fruit dosing mechanism, custom fabrication.Reference design and bill of materials, note 4.

Table 5.1The component build, priced line by line. The least mature line is the frozen-fruit dosing mechanism, custom fabrication with no off-the-shelf part found.

SubsystemRange, CAD
Dairy/perishables fridge$1,500–3,000
IQF fruit chest freezer$1,610–2,500
Chassis / food-zone enclosure *$1,500–4,000
Peristaltic pumps × 4 *$600–1,800
Contingency (~10%)$700–1,700
Water line-in + drain fittings *$500–1,500
NSF stainless prep tables × 2$420–1,800
Diaphragm pump (purée) *$400–900
IQF dosing mechanism (custom) *$300–800
Actuation electronics *$300–800
Cup sealer$260–400
Cup dispenser *$150–400
Tapioca hot-hold unit *$150–350
Ice machine$0 · chilled, not iced, by design
Subtotal, hardware only~$8,400–20,000

* Vendor capability confirmed, price quote-only; range estimated against the comparable market. The midpoint of the subtotal is roughly $14,000.Reference design bill of materials, sources accessed 2026-07-14.

Reliability is the bar

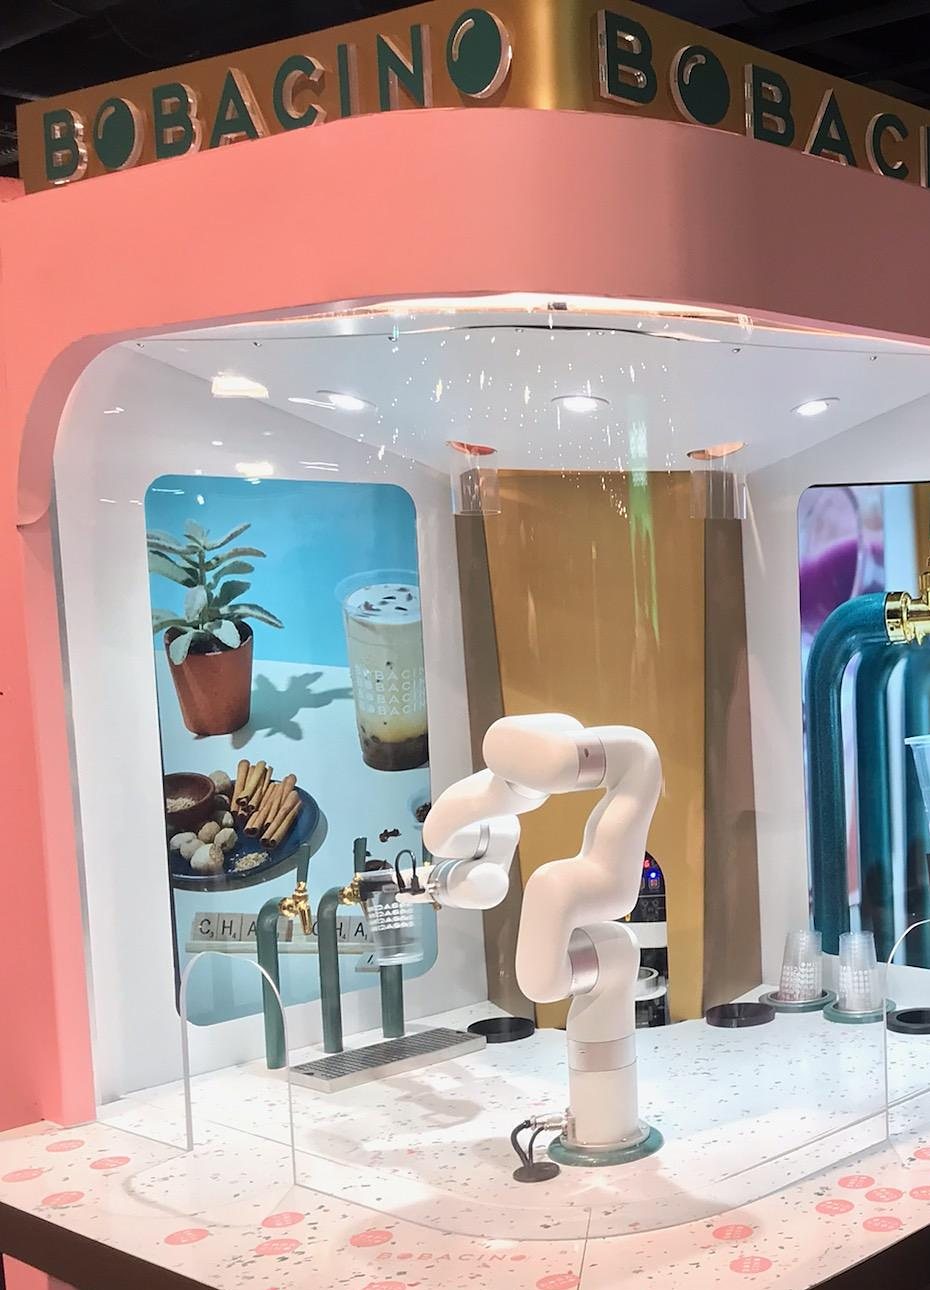
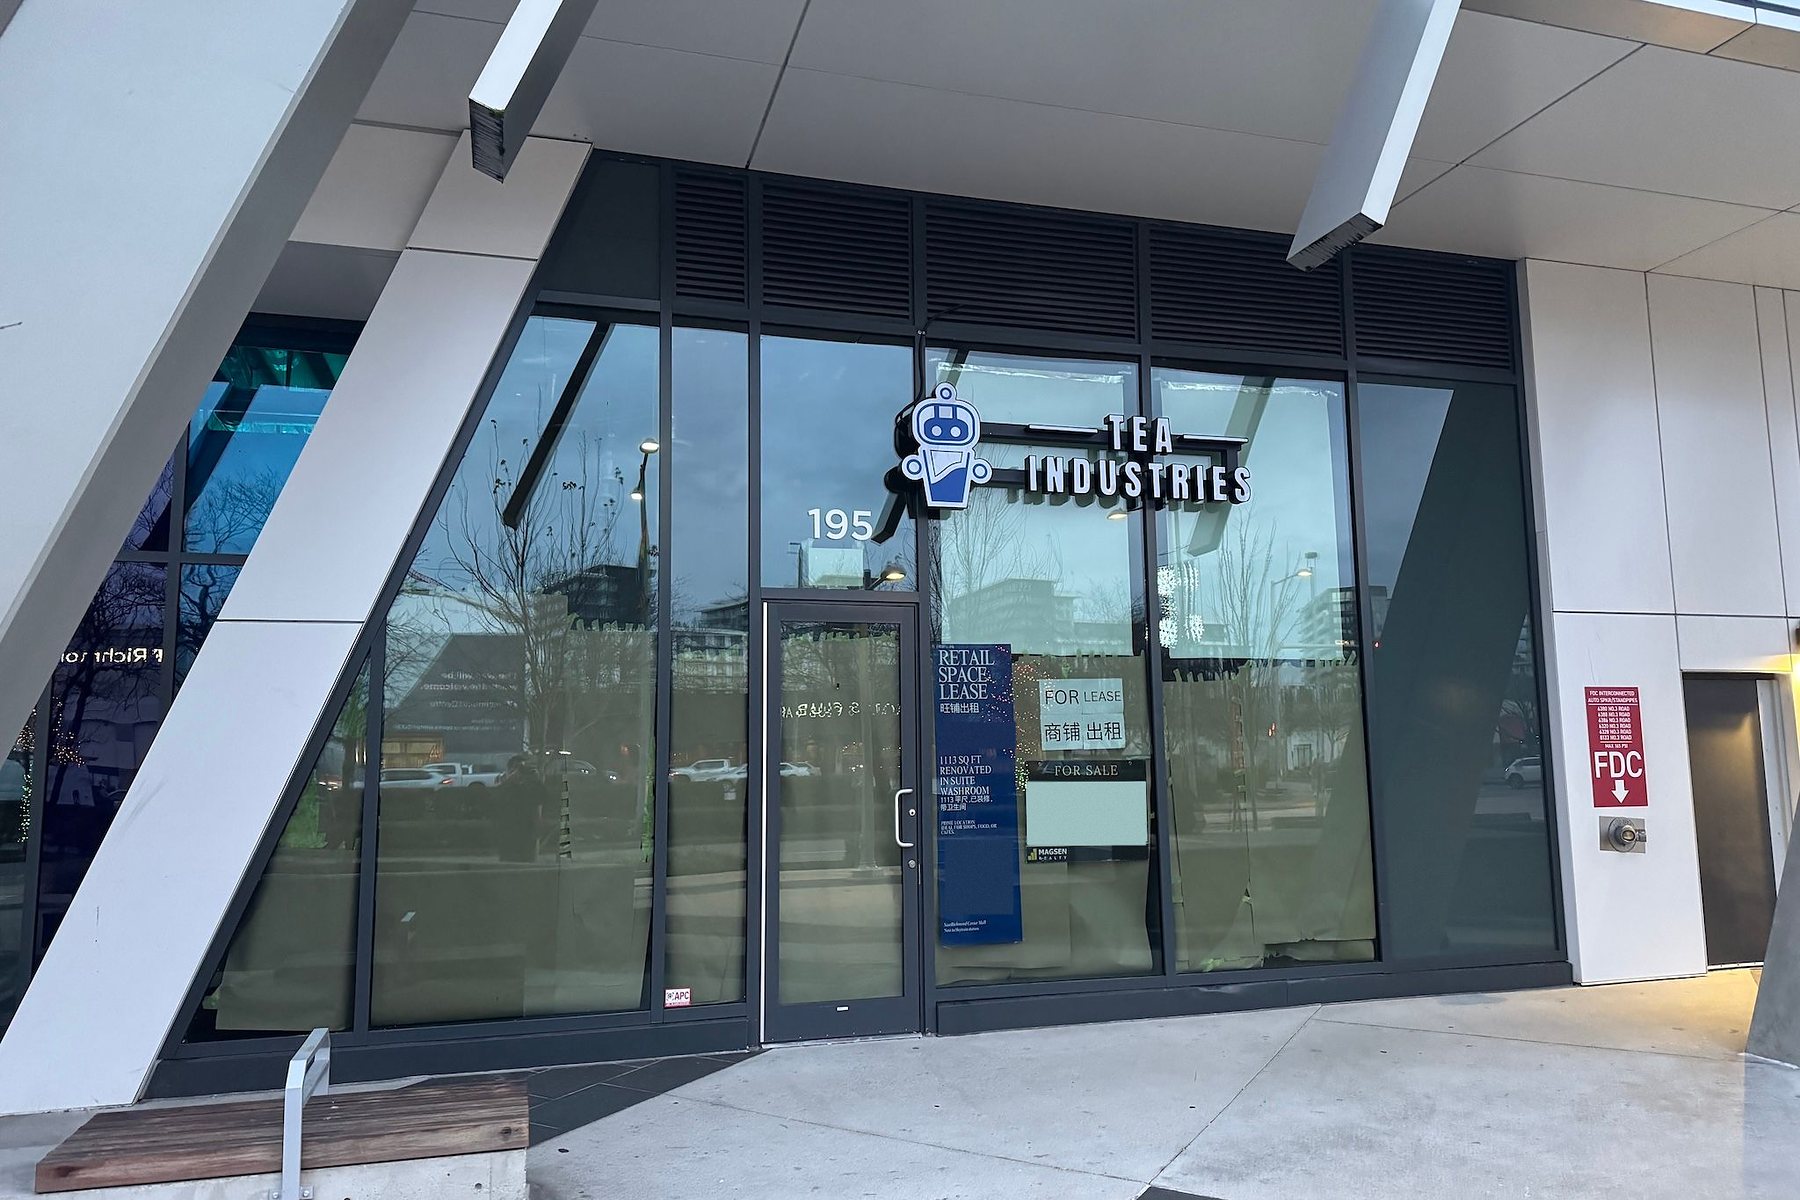
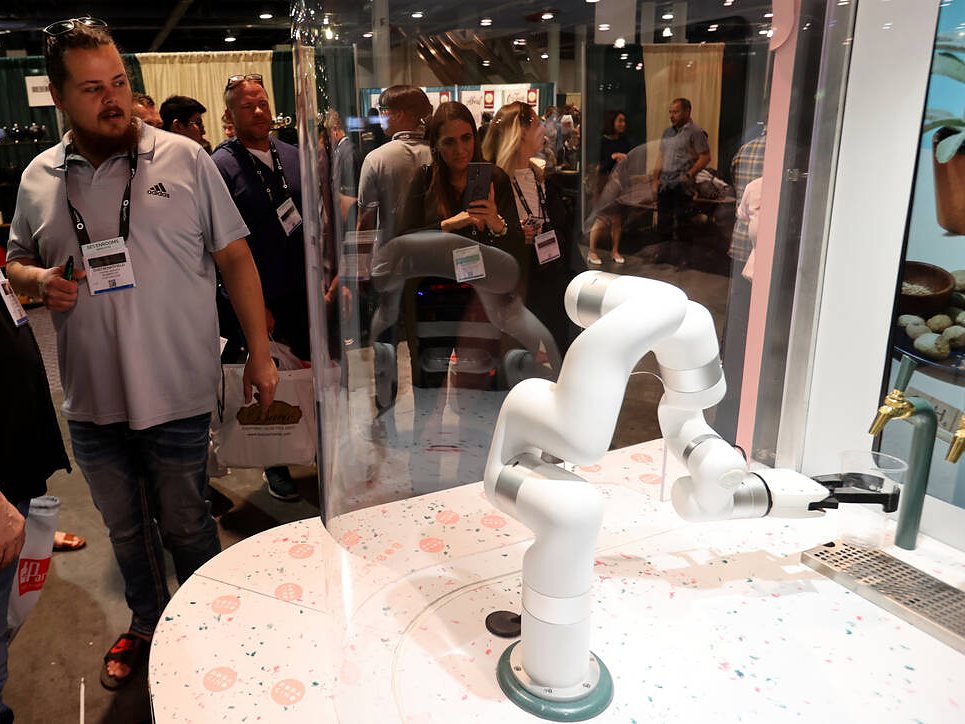
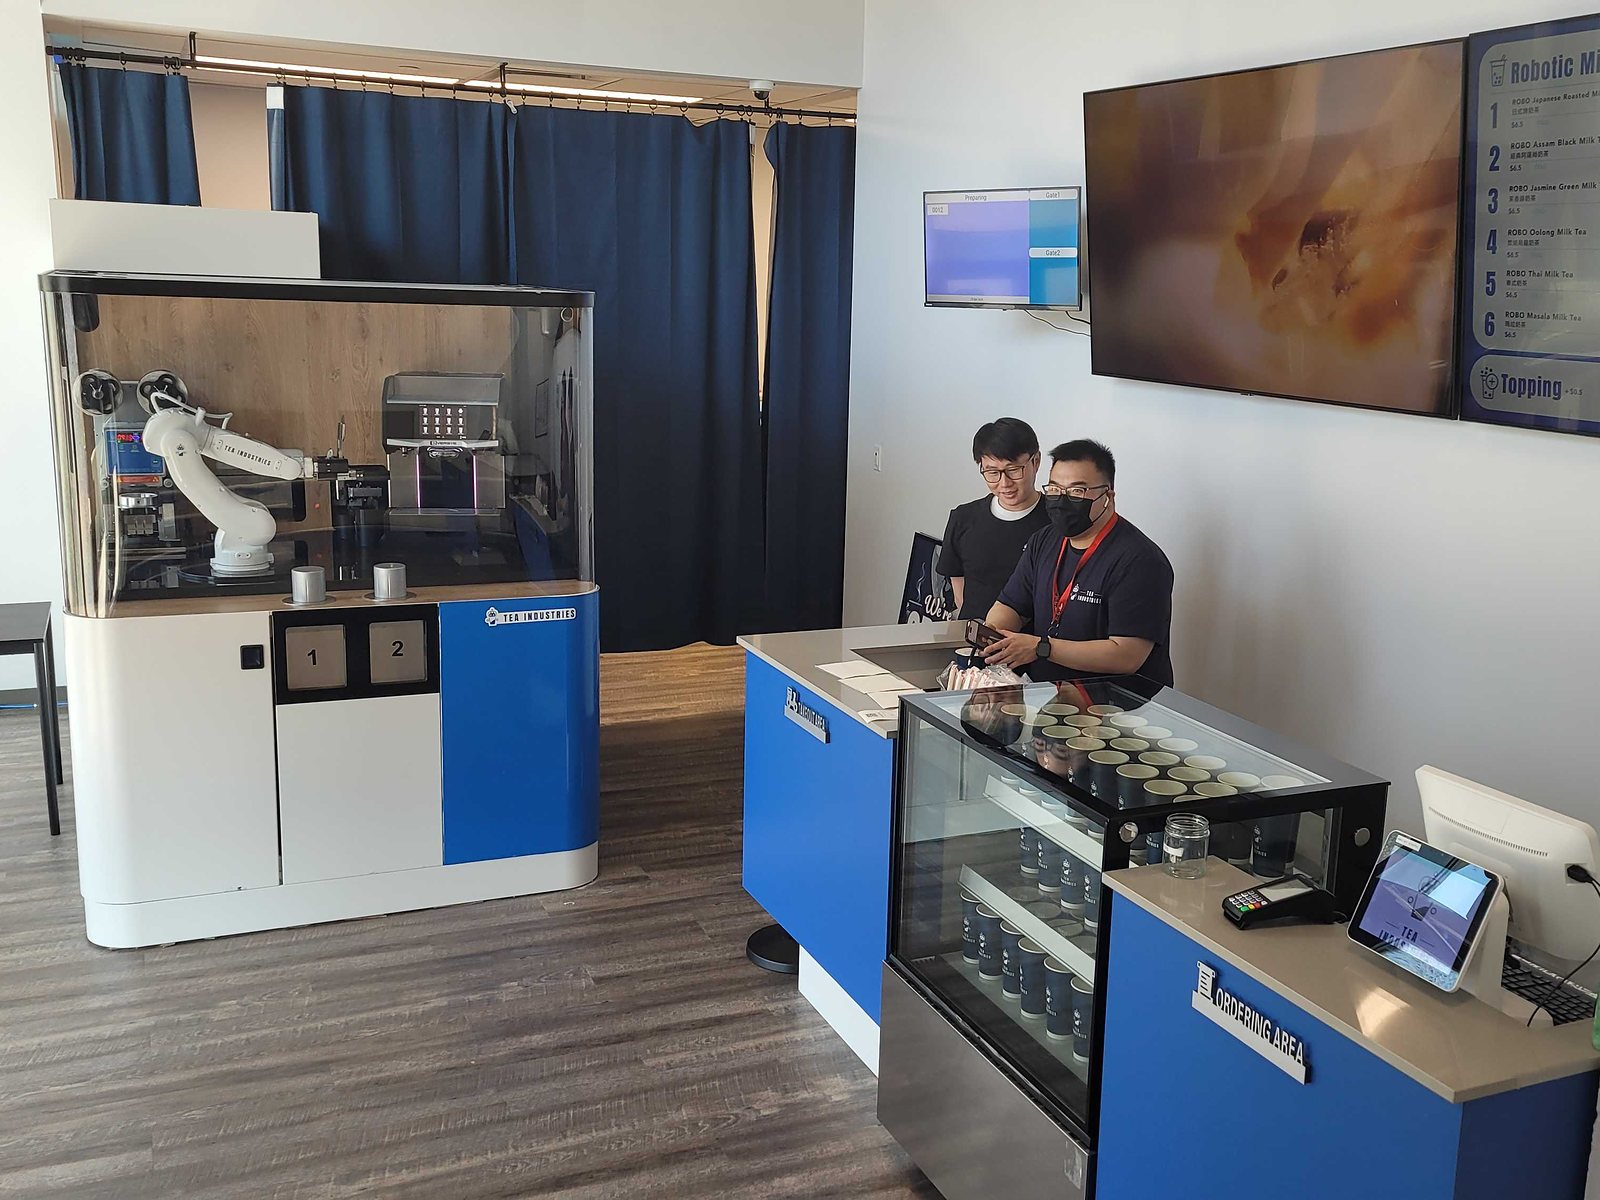
The category’s corporate history says a demonstration machine is the easy part. Bobacino raised about US$3.5 million for a robotic boba bar, showed it at trade shows, and closed without shipping a unit. Its chief executive resigned in November 2023, and by January 2024 it was reported shut down with other companies of its venture studio.5 Tea Industries, the first robot bubble-tea shop in British Columbia, opened in March 2024 and closed in 2025.5

Bobacino never shipped its bar, and Tea Industries closed its shop within two years of opening.
Bobacino’s pink demonstration bar with gold lettering, a white robot arm inside its lit glass bay beside gold taps
The closed Tea Industries storefront: the sign still mounted over papered-over windows with lease and sale notices
Figure 5.5Left: Bobacino’s demonstration bar on the floor of the World Tea Conference + Expo, Las Vegas, March 2022. Right: the Tea Industries storefront on No. 3 Road, Richmond, British Columbia, in December 2025, its sign still up over papered windows and lease notices. The shop had opened in March 2024.Photos: left, Aaron Kiel, World Tea News; right, Marco Ovies, Dished (Daily Hive).

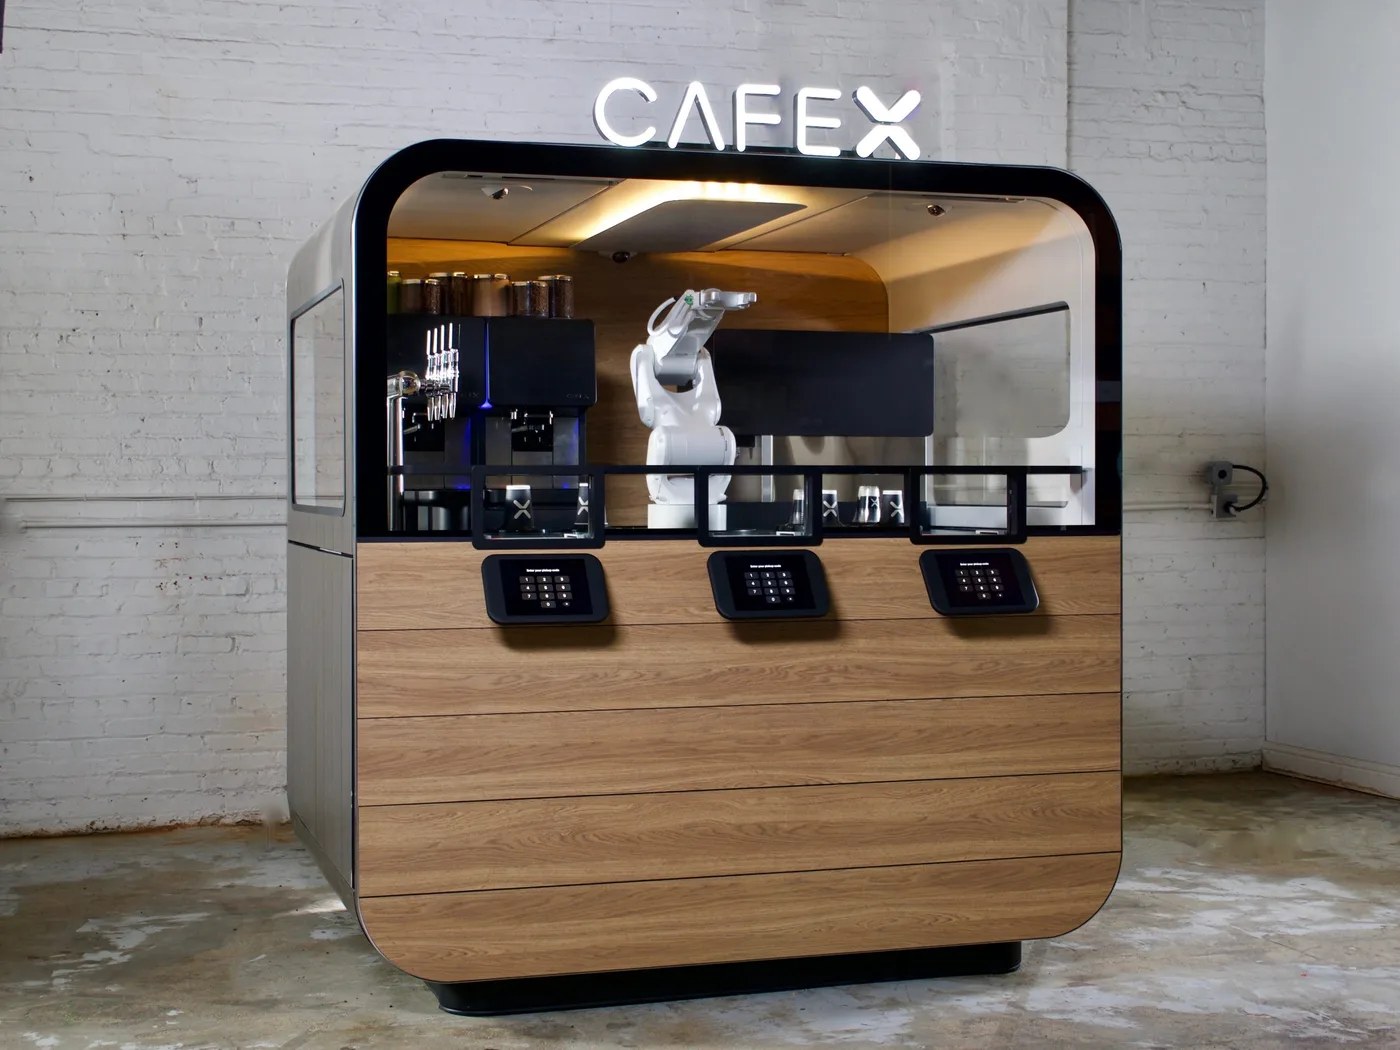
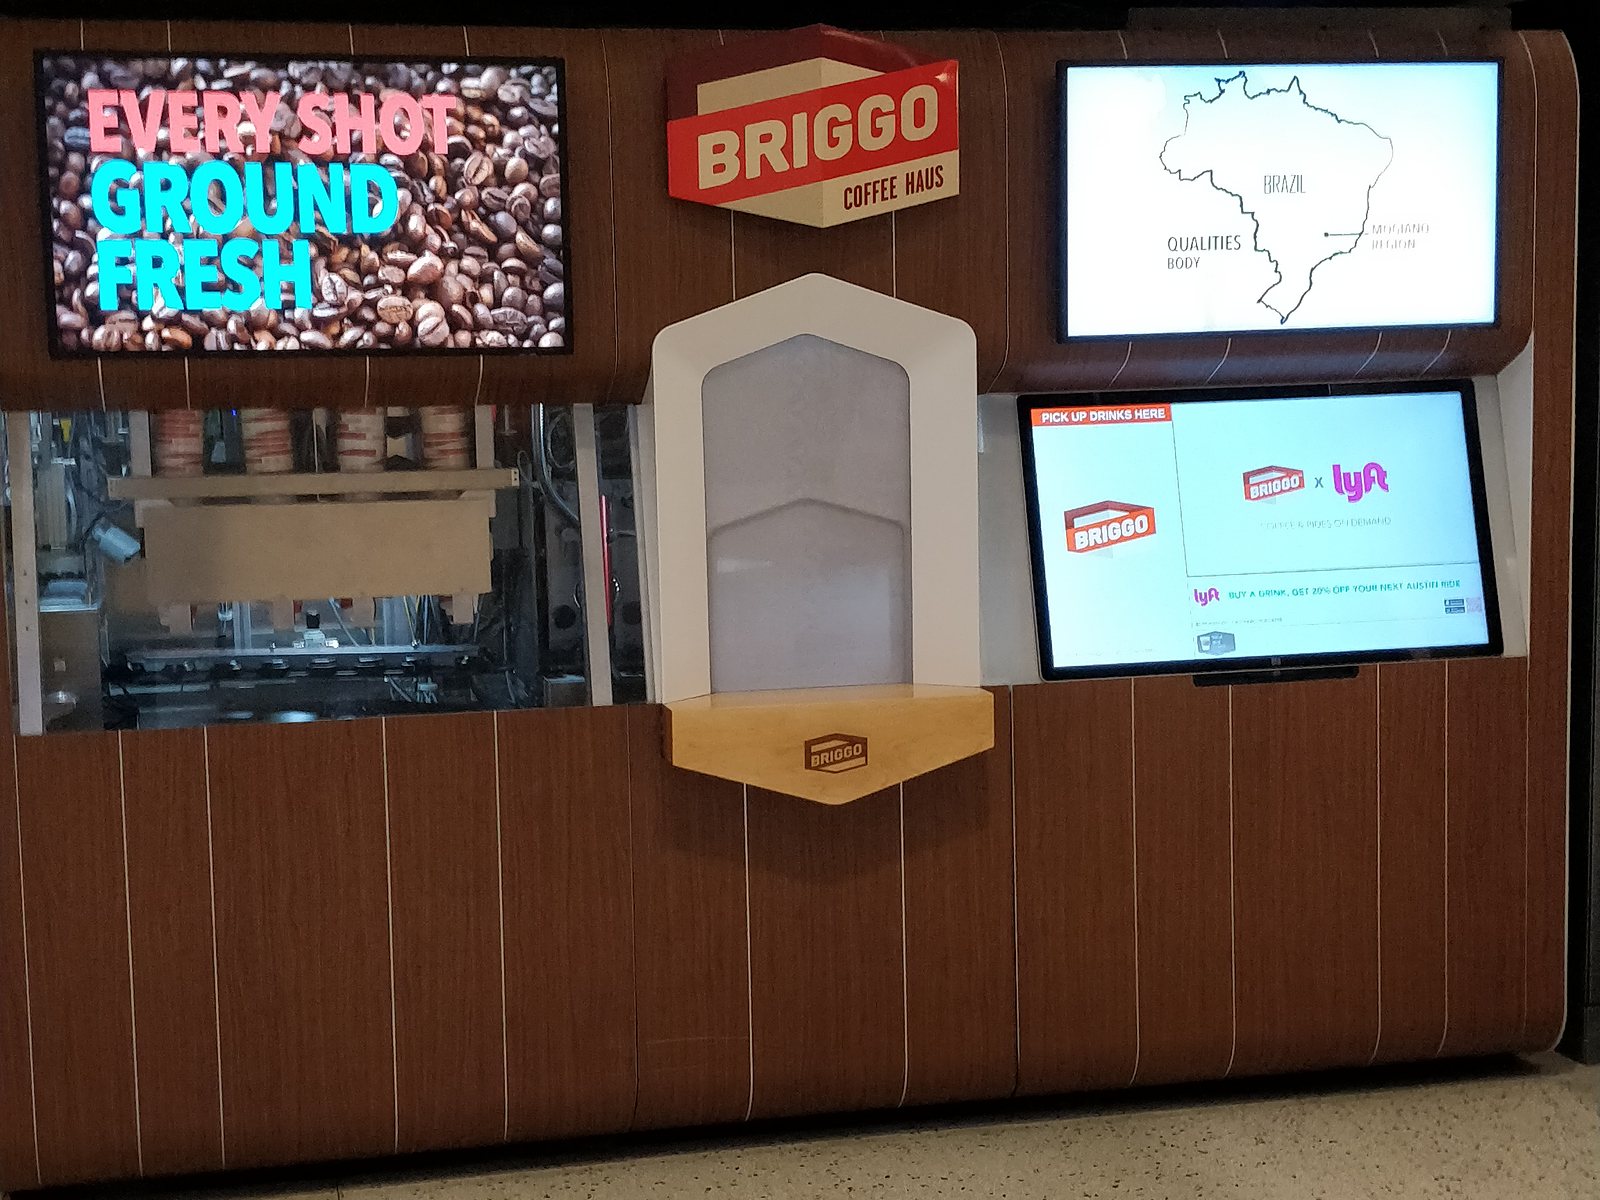
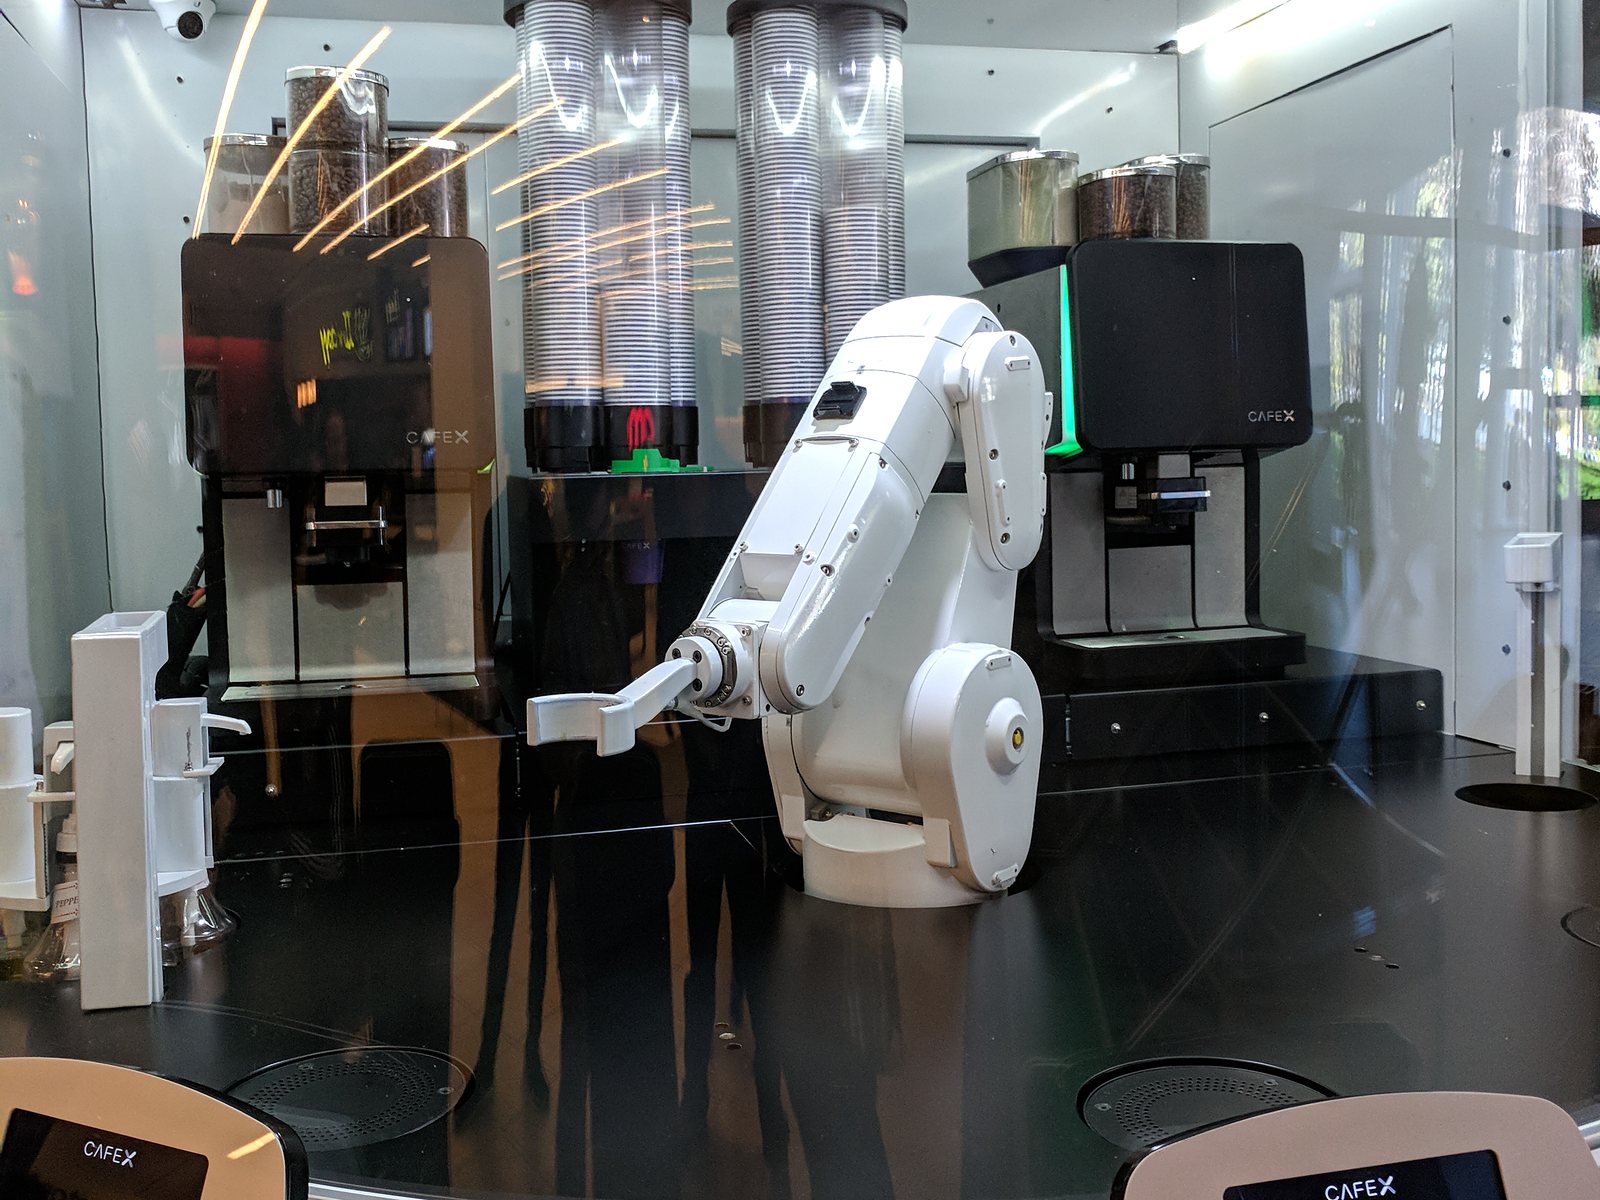
Cafe X closed its downtown San Francisco robot-coffee locations in January 2020 and retreated to airports. Crunchbase News reported that its founder wanted the company to be “less robot, more old-school coffee.” The pandemic closed the airport bars that year, and Cafe X reopened at San Francisco’s airport in 2021, where it runs three today.5 Briggo, which reported US$26 million of stock and note sales across a decade, exited by acquisition into a coffee incumbent.5 Machines with no human backstop depend on uptime, restock cadence, and a permit officer’s classification.

Cafe X robotic coffee kiosk with an industrial robot arm behind glass
Figure 5.6Cafe X’s robot-arm coffee bar, the downtown format it later closed. Company-by-company records, with what each raised and how each ended, are in Appendix D.Photo: Cafe X press imagery.

Verdict of the assessment: at the study’s $15–20K tier, build, do not buy. No researched machine lands compliant under $20K; the component build is the only path that clears cost, payment ownership, and the certification story at once.

The machine, however, was never the binding constraint. Chapters 03 and 07, and the category record of Appendix D, are where the format failed.

Notes

  1. Overseas marketplace listings for robot-arm and elevator-style bubble-tea machines (alibaba.com showrooms), and vendor pages for the named platforms (Smoodi US$14,999 outright; a smoothie-vending OEM at US$9,500 FOB; a Taiwanese vendor claiming point-of-sale API openness), all accessed 2026-07-14. FX at 1 USD = 1.415 CAD, Bank of Canada-range market rate for the week of 2026-07-07.
  2. Worked landed-cost example: LCL ocean freight $80–200 per cubic metre; duty scenarios under tariff headings 8476.89 (free) versus 8476.21 (unconfirmed) with no Canada–China surtax applying to this equipment class; 5% GST on the duty-paid value; brokerage $175–230; an Electrical Safety Authority field evaluation under SPE-1000, no published price, estimated $2,000–6,000. Sources: tariffnumber.com, ghy.com, esasafe.com (fees revised 2026-04-01), all accessed 2026-07-14. The researched Chinese units carry CE/CB/ISO marks only, none a Canadian electrical approval.
  3. Multi-drop bus (MDB) as the documented integration path for third-party vending payment (nayax.com glossary, accessed 2026-07-14); dominance of sealed domestic mobile-payment rails in the exporting market (oceanpayment.com, accessed 2026-07-14).
  4. Component reference design and bill of materials: commercial merchandiser fridge, chest freezer (gofoodservice.com), NSF-certified peristaltic dosing pumps (dispensingcomponents.com), food-contact diaphragm pumps (graco.com, arozone.com), pearl warmer, semi-automatic cup sealer (lollicupstore.com), NSF prep tables (katom.com), all accessed 2026-07-14. NSF/ANSI 18 covers component-level dispensing equipment (webstore.ansi.org, accessed 2026-07-14).
  5. Tea Industries closure, Daily Hive; Cafe X retreat, The Spoon, Axios and Crunchbase News (January 2020); Briggo acquisition, Daily Coffee News (November 2020); accessed 2026-07-14. Bobacino, SEC Forms 1-SA and 1-U and Hubtas (2024-01-30); Briggo, SEC Forms D (2012–2019); Cafe X at SFO, The Spoon (2021-01-21) and cafexapp.com; accessed 2026-10-02.
The bench kiosk, a small touchscreen on a wooden bench, showing a tap-to-order drink menu

Chapter 06

The platform build

While the retail question was being researched, the software it would need was built by one founder over 76 days and tested to destruction.

In this chapter

  1. 6.1Money state machines, built for missing webhooks
  2. 6.2The live transaction
  3. 6.3The edge experiment

At a glance

173
commits in 76 days, one founder
19 · 71
adversarial scenarios and checks; all held
$1.99
a live purchase on production rails, July 9

The bench unit, a single-board computer behind a small touchscreen, July 2026. Photographed on the bench, July 2026.

Corner’s platform is a production-grade payments and inventory system: 173 commits from April 30 to July 14, 2026; 57 API route handlers; 20 database tables, every one carrying row-level security; 48 schema migrations; 44 automated regression suites.1 It ships four ways to move money: a code-confirmed shopper checkout, a cash and external-card walk-in register, tap-to-pay through a card processor’s terminal rails, and an unattended charge-on-exit loop for a store with nobody in it.

Seventy-six days of commits, one founder.
commits per day06121824MayJuneJuly04-30: 1 commits05-01: 5 commits05-03: 5 commits05-10: 5 commits05-12: 22 commits05-13: 8 commits05-17: 1 commits05-19: 2 commits05-22: 4 commits05-24: 9 commits05-25: 6 commits05-26: 4 commits05-27: 6 commits05-28: 14 commits05-29: 6 commits06-02: 1 commits06-09: 1 commits06-10: 7 commits06-12: 5 commits06-15: 5 commits06-16: 2 commits06-30: 2 commits07-02: 2 commits07-03: 9 commits07-08: 4 commits07-09: 12 commits07-10: 8 commits07-13: 12 commits07-14: 5 commits22 · design + voice day14 · payments + hardening12 · doctrine + close
Figure 6.1Commit cadence across the program. The bursts are build days; the quiet weeks are when the strategy questions of chapters 02 to 05 were being worked instead.git history of the platform repository, counted per author date through the close-out commit.

Money state machines, built for missing webhooks

The design assumption throughout: the network is unreliable and event delivery is optional. Every money mutation takes a mandatory idempotency key through a reserve-then-complete envelope; every webhook is deduplicated by event identity; and a reconciliation job converges any stuck payment or refund against the processor’s truth through the same idempotent operations, so webhook delivery is a latency optimization rather than a correctness dependency.

Refunds on the terminal path are two-phase and confirmed by event, with an atomic claim so two concurrent refund attempts cannot both fire.

One money operation, three ways in: a lost webhook can delay a payment’s final state, not corrupt it.
Requestcheckout, register, terminal,charge-on-exit; idempotency keyWebhookfrom the card processor;deduplicated by event identityReconciliation jobconverges stuck payments andrefunds against the processorOne money operationidempotentreserve, then completethe same code, every way inCard processorcharges, refundsLedger of recordin the cloudwebhook delivery is a latency optimization,not a correctness dependencyThe store’s device never holds payment authority. Terminal refunds are two-phase, confirmed by event, with an atomic claim.
Figure 6.2A request, a webhook and the reconciliation job all arrive at the same idempotent operation, so webhook delivery is a latency optimization rather than a correctness dependency. The store’s device never holds payment authority; the cloud is the ledger of record.The platform as built, close-out commit, July 14, 2026.

That posture was then attacked on purpose. Nineteen adversarial scenarios, 71 checks: oversell races, idempotency storms, duplicate-webhook floods, cron-versus-webhook finalize races, decline storms with inventory restore, out-of-order refund events, reconciliation cap saturation. All nineteen held. The destruction pass surfaced exactly one real defect, an idempotency key that leaked across two transactions; it was fixed and the pass re-run clean.2

Table 6.1Nineteen adversarial scenarios against the money loop; all held. Scenario S found the run’s one real defect.

#ScenarioSuiteResult
AOversell racelocal concurrencyheld
BIdempotency stormlocal concurrencyheld
CRate-limit burstlocal concurrencyheld
DConcurrent refundlocal concurrencyheld
ECheckout key stormlocal concurrencyheld
FRefund-initiate stormlive payment railsheld
GCron ∥ webhook racelive payment railsheld
HDuplicate webhookslive payment railsheld
IPersist-race adoptlive payment railsheld
JDecline stormlive payment railsheld
KWebhook-drop convergelive payment railsheld
LCron-only backstoplive payment railsheld
MRate-limit isolationlive payment railsheld
NReconcile caplive payment railsheld
OCross-path collisionlive payment railsheld
PPending refund arclive payment railsheld
QOut-of-order eventslive payment railsheld
RTwo-cron racelive payment railsheld
SKey reuse across transactionslive payment railsheld · found the one real defect (fixed, re-run clean)

The platform’s chaos suites: 23 local concurrency checks; 48 checks against live test-mode payment rails, June 2026.

The live transaction

The loop was proven with money. A physical bench unit, a single-board computer driving a real lock behind a small touchscreen, rang up a live $1.99 purchase by phone wallet against production infrastructure on July 9, 2026: charged on the studio’s own merchant account and receipted with no personal data, then refunded by hand from the processor’s dashboard.

The refund exposed a gap the program recorded rather than closed: nothing ingests a dashboard-initiated refund, so the platform’s own ledger still reads the sale as succeeded.3

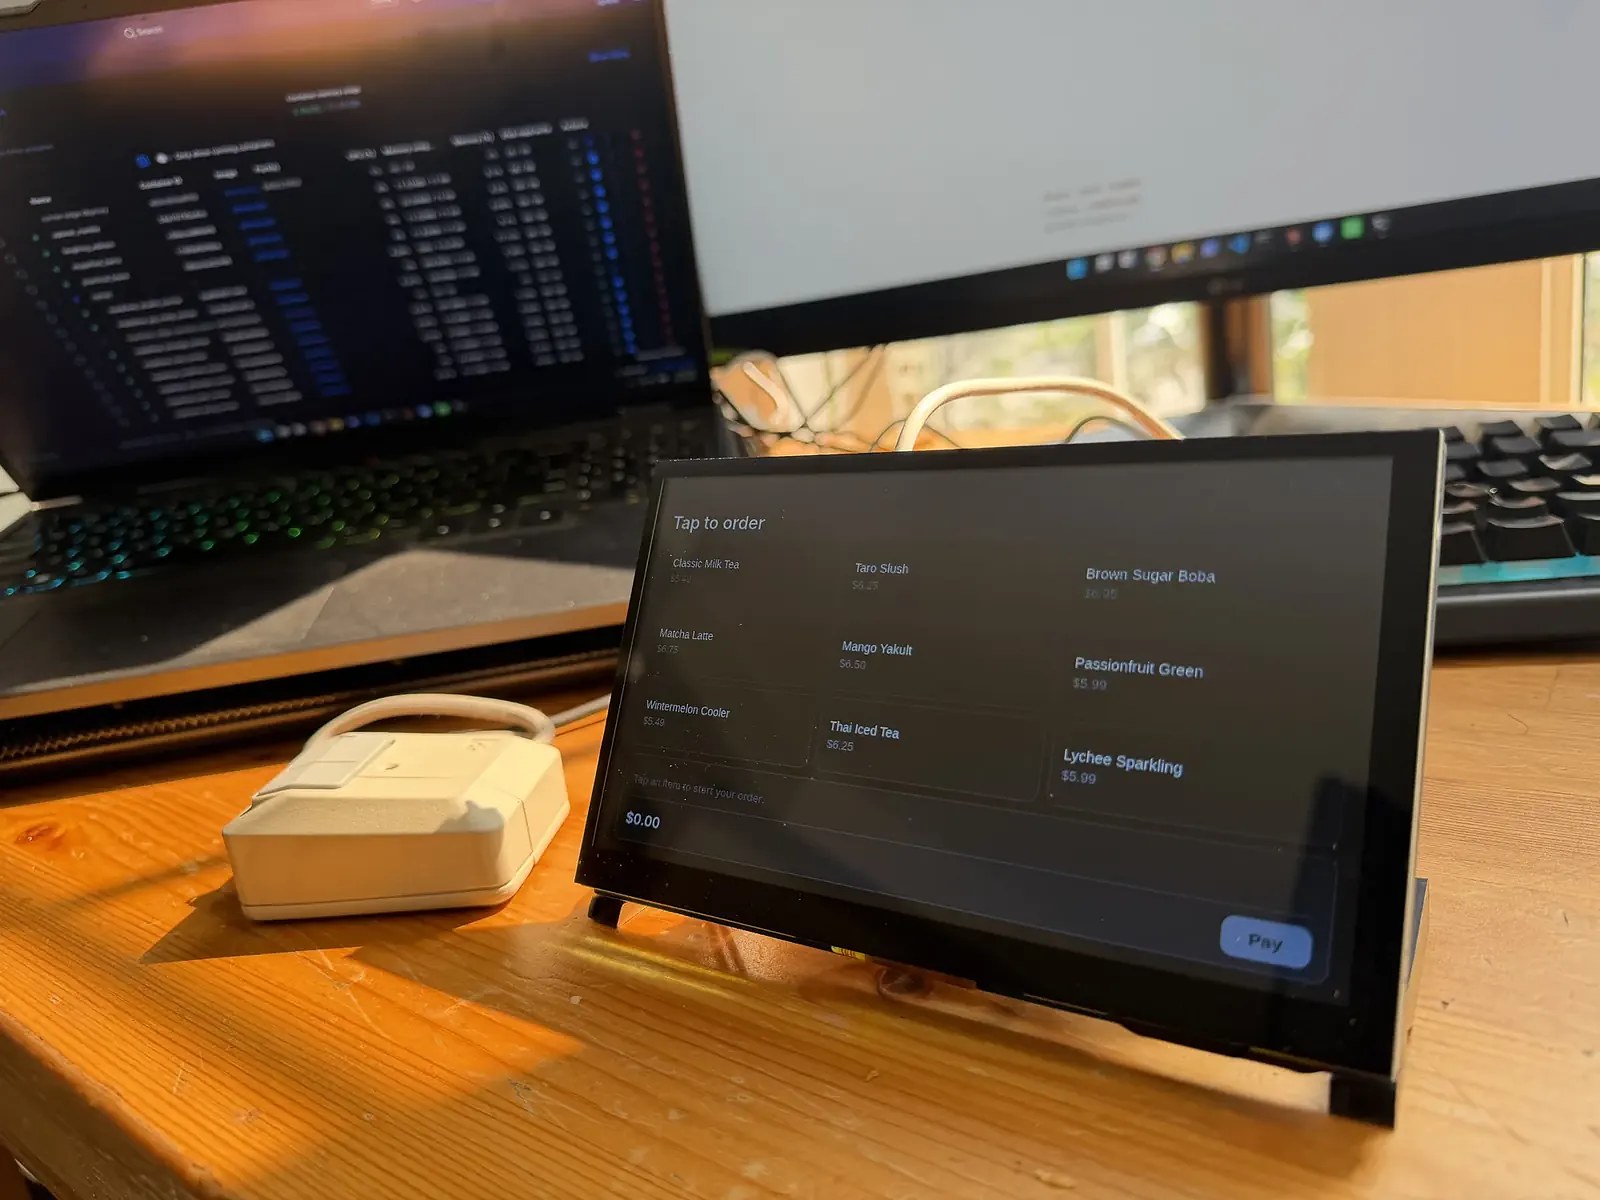
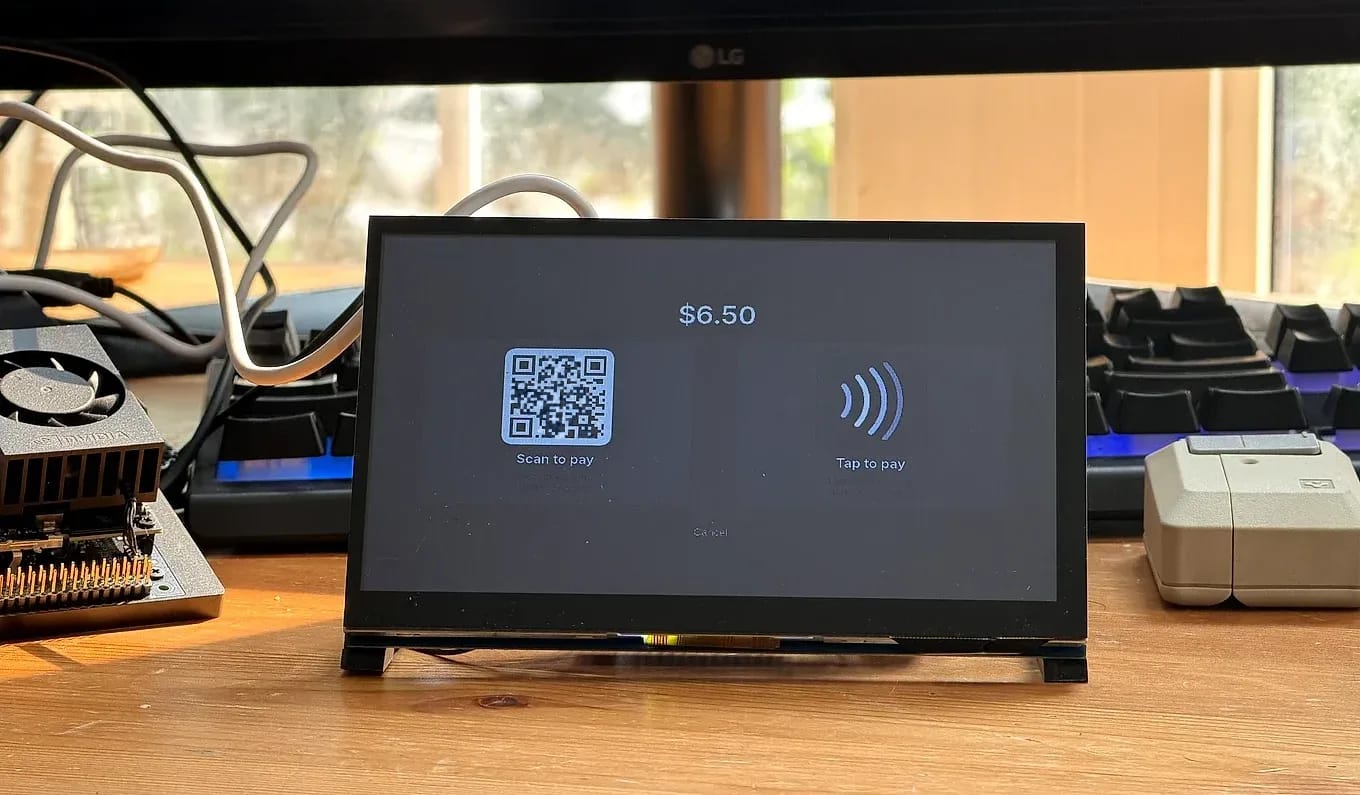
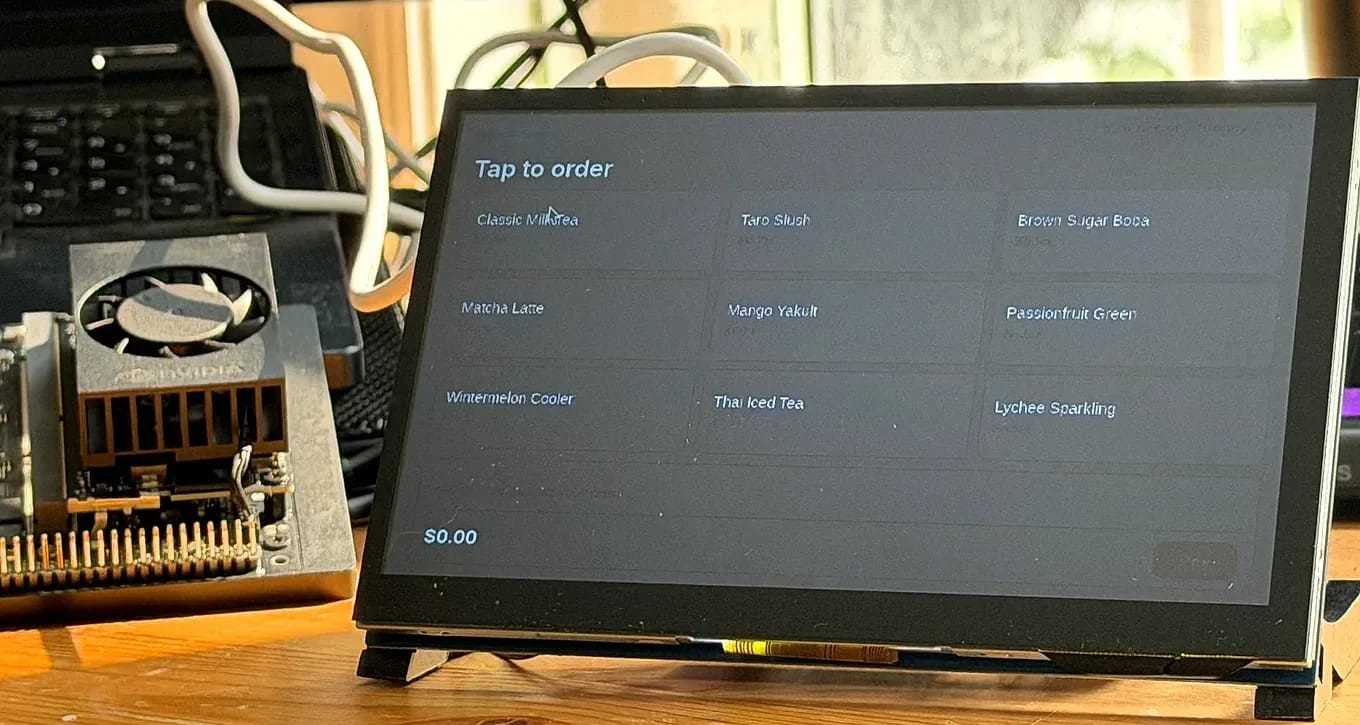
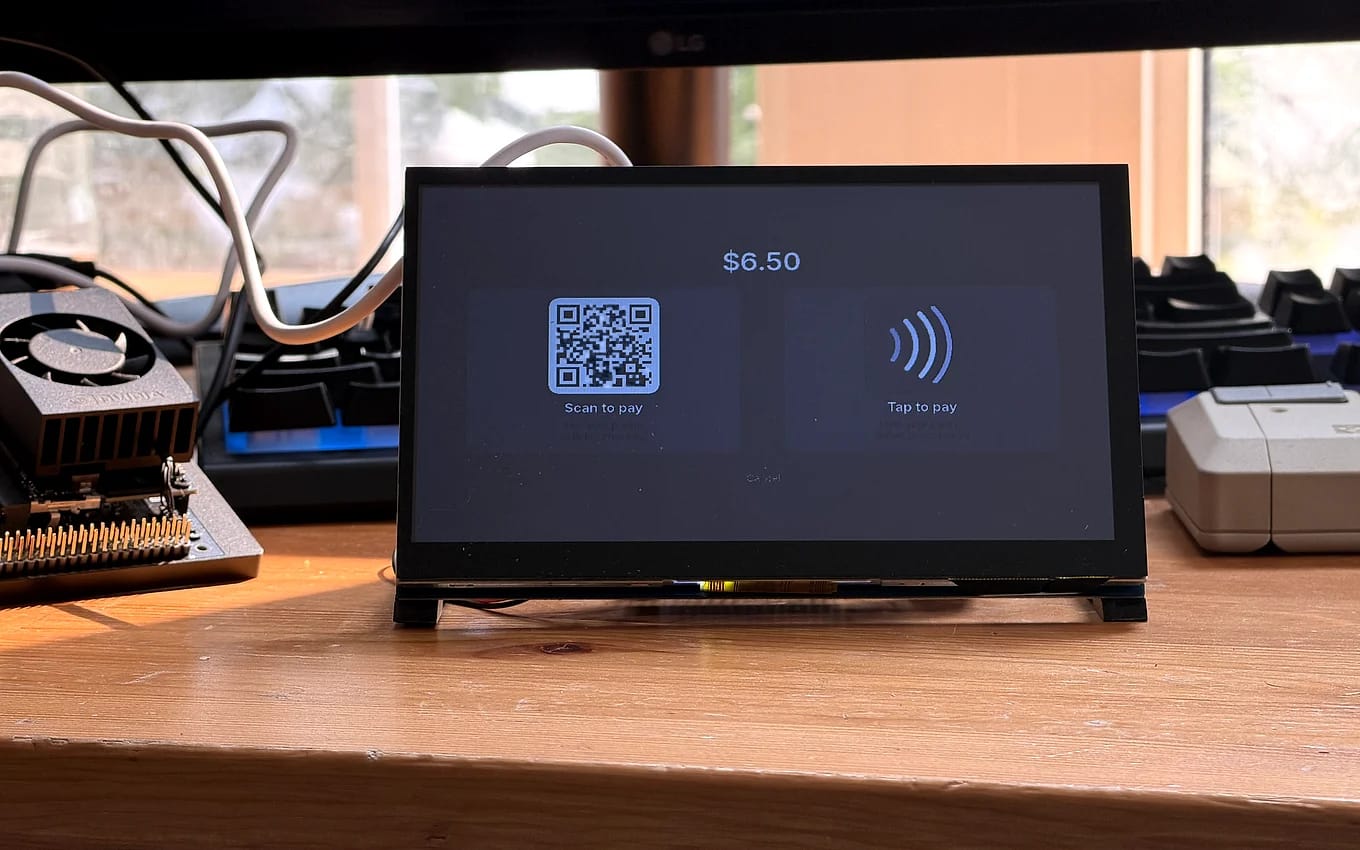
The bench unit, from a few angles.
The bench unit on a workbench, its touchscreen showing checkout: total $6.50 with a scan-to-pay QR beside a contactless tap-to-pay symbol.
The bench unit showing the fresh-drink order menu, a grid of drink options under a Tap to order heading.
The bench unit’s checkout screen seen from the side, the scan-to-pay and tap-to-pay tiles at an angle.
Figure 6.3The physical bench unit on the workbench: a single-board computer behind an 800 by 480 touchscreen, driving a real lock. Left to right: checkout, with a contactless “tap to pay” beside the phone-handoff QR; the menu grid; and the checkout again, from further back. The screens run the fresh-drink catalogue that chapters 05 and 07 model.Photographed on the bench, July 2026; demo configuration. The kiosk software’s wordmark is retouched out of the screens. The on-screen QR was staged for the shoot and now leads to this study.
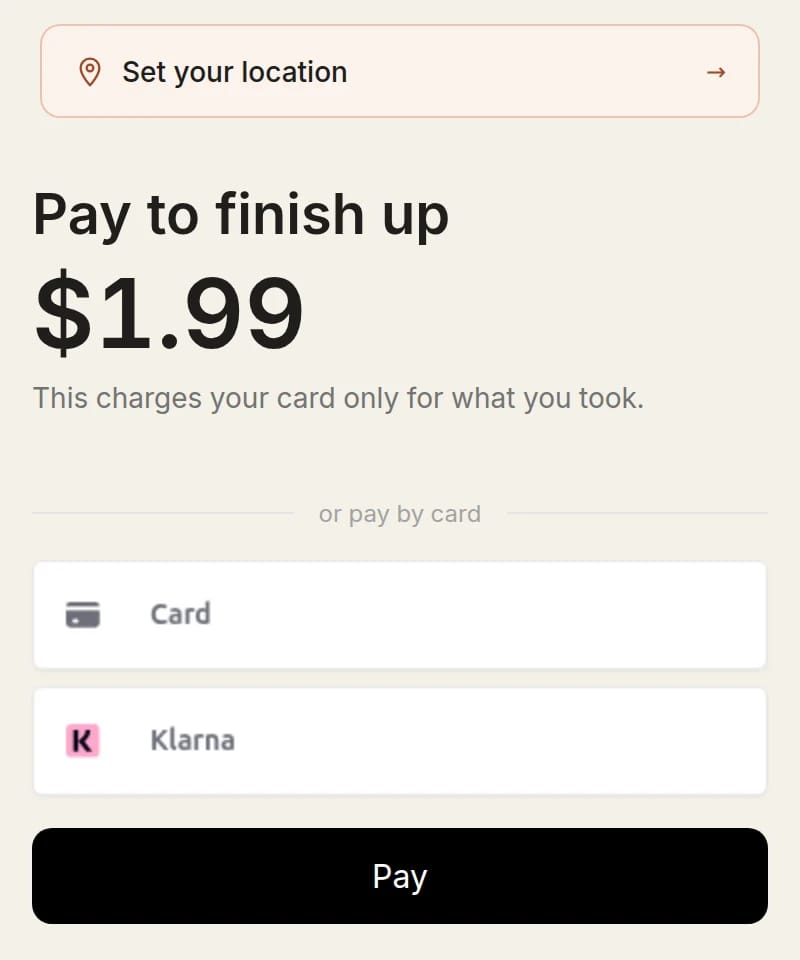
The shopper’s side: the phone checkout, and the July 9 charge.
Phone checkout page reading Pay to finish up, $1.99, this charges your card only for what you took, with card and wallet optionsA banking app showing a pending $1.99 charge from Corner Toronto Can on July 9
Figure 6.4Left: the phone checkout the kiosk’s QR opens, backed by the payment processor’s own elements; on a real phone the wallet sheet sits above the card form. Right: the actual July 9 live purchase, $1.99, as it appeared in the cardholder’s banking app.Phone checkout: capture of the live surface, test rails, July 15, 2026. Bank app capture: July 9, 2026, cropped to the one charge.

The edge experiment

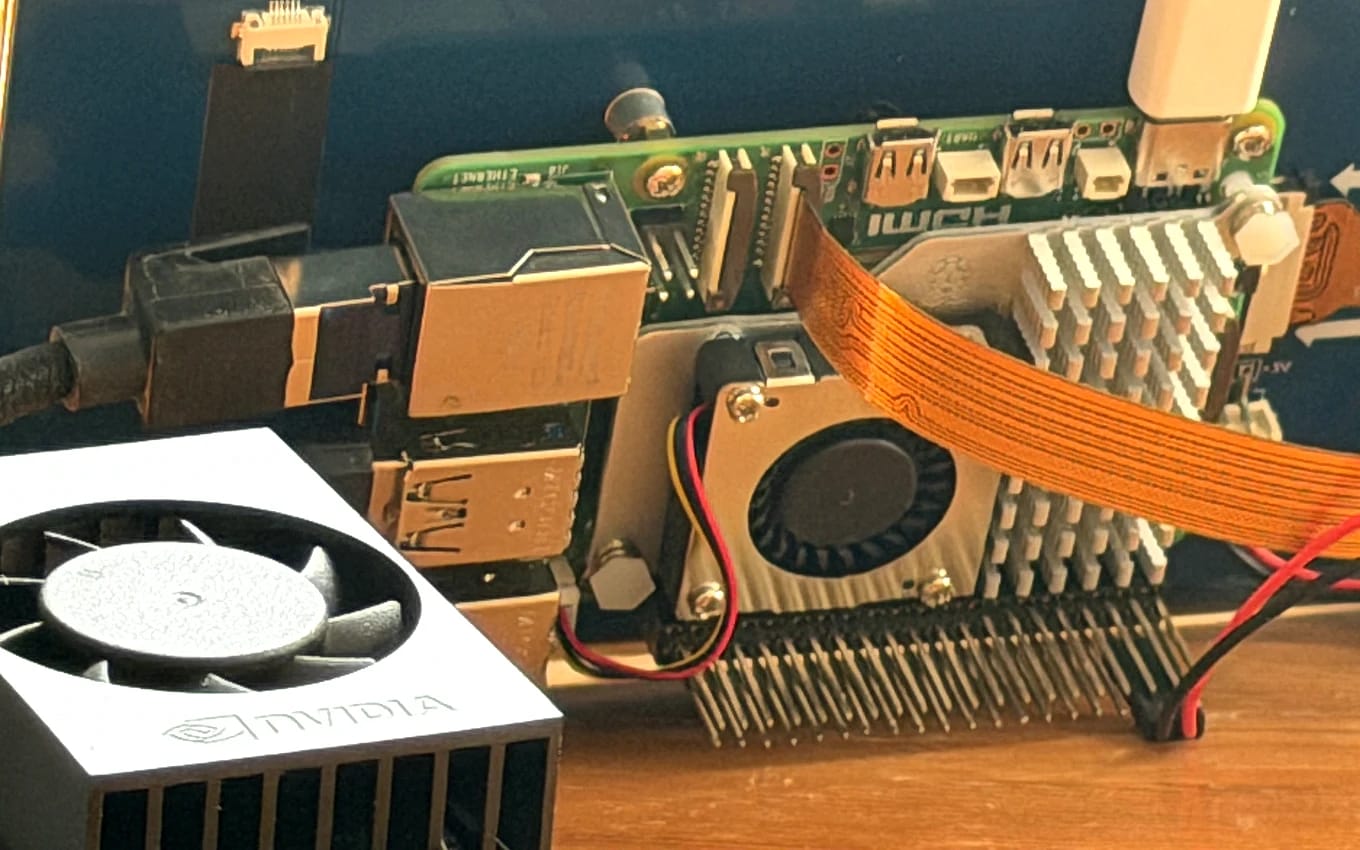
An NVIDIA-branded heatsink and fan on a Jetson-class edge computer, wired up on a workbench beside the board.
Figure 6.5The $250 box: the NVIDIA Jetson-class edge computer the voice spike ran on, the language and speech models co-resident under the heatsink, beside the single-board computer driving the kiosk screen. The cloud keeps payment authority.Photographed on the bench, July 2026.

A parallel spike asked whether store intelligence could live in the store. On a $250-class edge computer with 8 GB of memory, a 3-billion-parameter language model and a speech-to-text model run co-resident; voice commands in the common case complete end to end in about 2.6 seconds, under the program’s 4-second bar.4

Two software levers did the work: a deterministic fast path that skips the model entirely for unambiguous commands, and grammar-constrained decoding against an indexed stock list, which cut the model’s proposal latency from 8.8 to 2.9 seconds.4 The edge device never holds payment authority; the cloud stays the ledger of record.

Voice on a $250 box, with software alone: the model’s 8.8 seconds cut to 2.9, and 2.6 end to end, under the 4-second bar.
0s2s4s6s8s10sseconds, measured on the boxFree-form generationthe 3B model proposes, unconstrainedFree-form generation: 8.8s8.8sGrammar-constrained decodeoutput pinned to an indexed stock listGrammar-constrained decode: 2.9s2.9sDeterministic fast pathclear commands skip the model entirelyDeterministic fast path: about 0s~0sEnd-to-end voice, Englishspeech to applied action, common caseEnd-to-end voice, English: 2.6s2.6sthe 4-second bar
Figure 6.6The latency levers. Mandarin lands around 3.7 seconds; Tamil, at roughly 5.9, is the documented miss.Edge hardware spike, June 2026, measured on-device; per-language results as recorded, including the documented Tamil miss.

The platform, the money state machines, the chaos suites, and the edge pattern are assets of the studio, independent of any particular corner.

Notes

  1. Counts audited at the program’s close-out commit, 2026-07-14: commits, route handlers, tables with row-level security, migrations, and regression suites counted directly from the repository tree and git history.
  2. Chaos suites: 23 checks across five local concurrency scenarios; 48 checks across fourteen adversarial scenarios against live test-mode payment rails, all fourteen held, one defect found (cross-transaction idempotency-key leak), fixed and re-verified, June 2026.
  3. Live-mode verification, 2026-07-09: $1.99 wallet purchase on the bench unit against production, charged and subsequently refunded on the studio’s own merchant account.
  4. Edge spike, June 3–9, 2026, on an 8 GB Jetson-class single-board computer: 3B-parameter instruct model plus whisper-class speech-to-text co-resident; English end-to-end voice ~2.6 s, Mandarin ~3.7 s, Tamil ~5.9 s (the documented miss); grammar-constrained decode 8.8 s → 2.9 s.
Rows of fruit juices and smoothies in plastic cups with coloured straws, packed in crushed ice at a market stall, with handwritten flavour signs

Chapter 07

Unit economics

The zero-labour drink store clears its running costs at four cups a day. The problem is paying back the capital, at demand anyone has measured.

In this chapter

  1. 7.1The per-cup model
  2. 7.2Volume scenarios
  3. 7.3Capital, fully totalled
  4. 7.4Then apply chapter 03

At a glance

$3.87
contribution per cup, at 30 percent cost of goods
3.8
cups a day to clear running costs
27.0 mo
payback of the smallest real stack at 12 cups a day, against a 24-month line

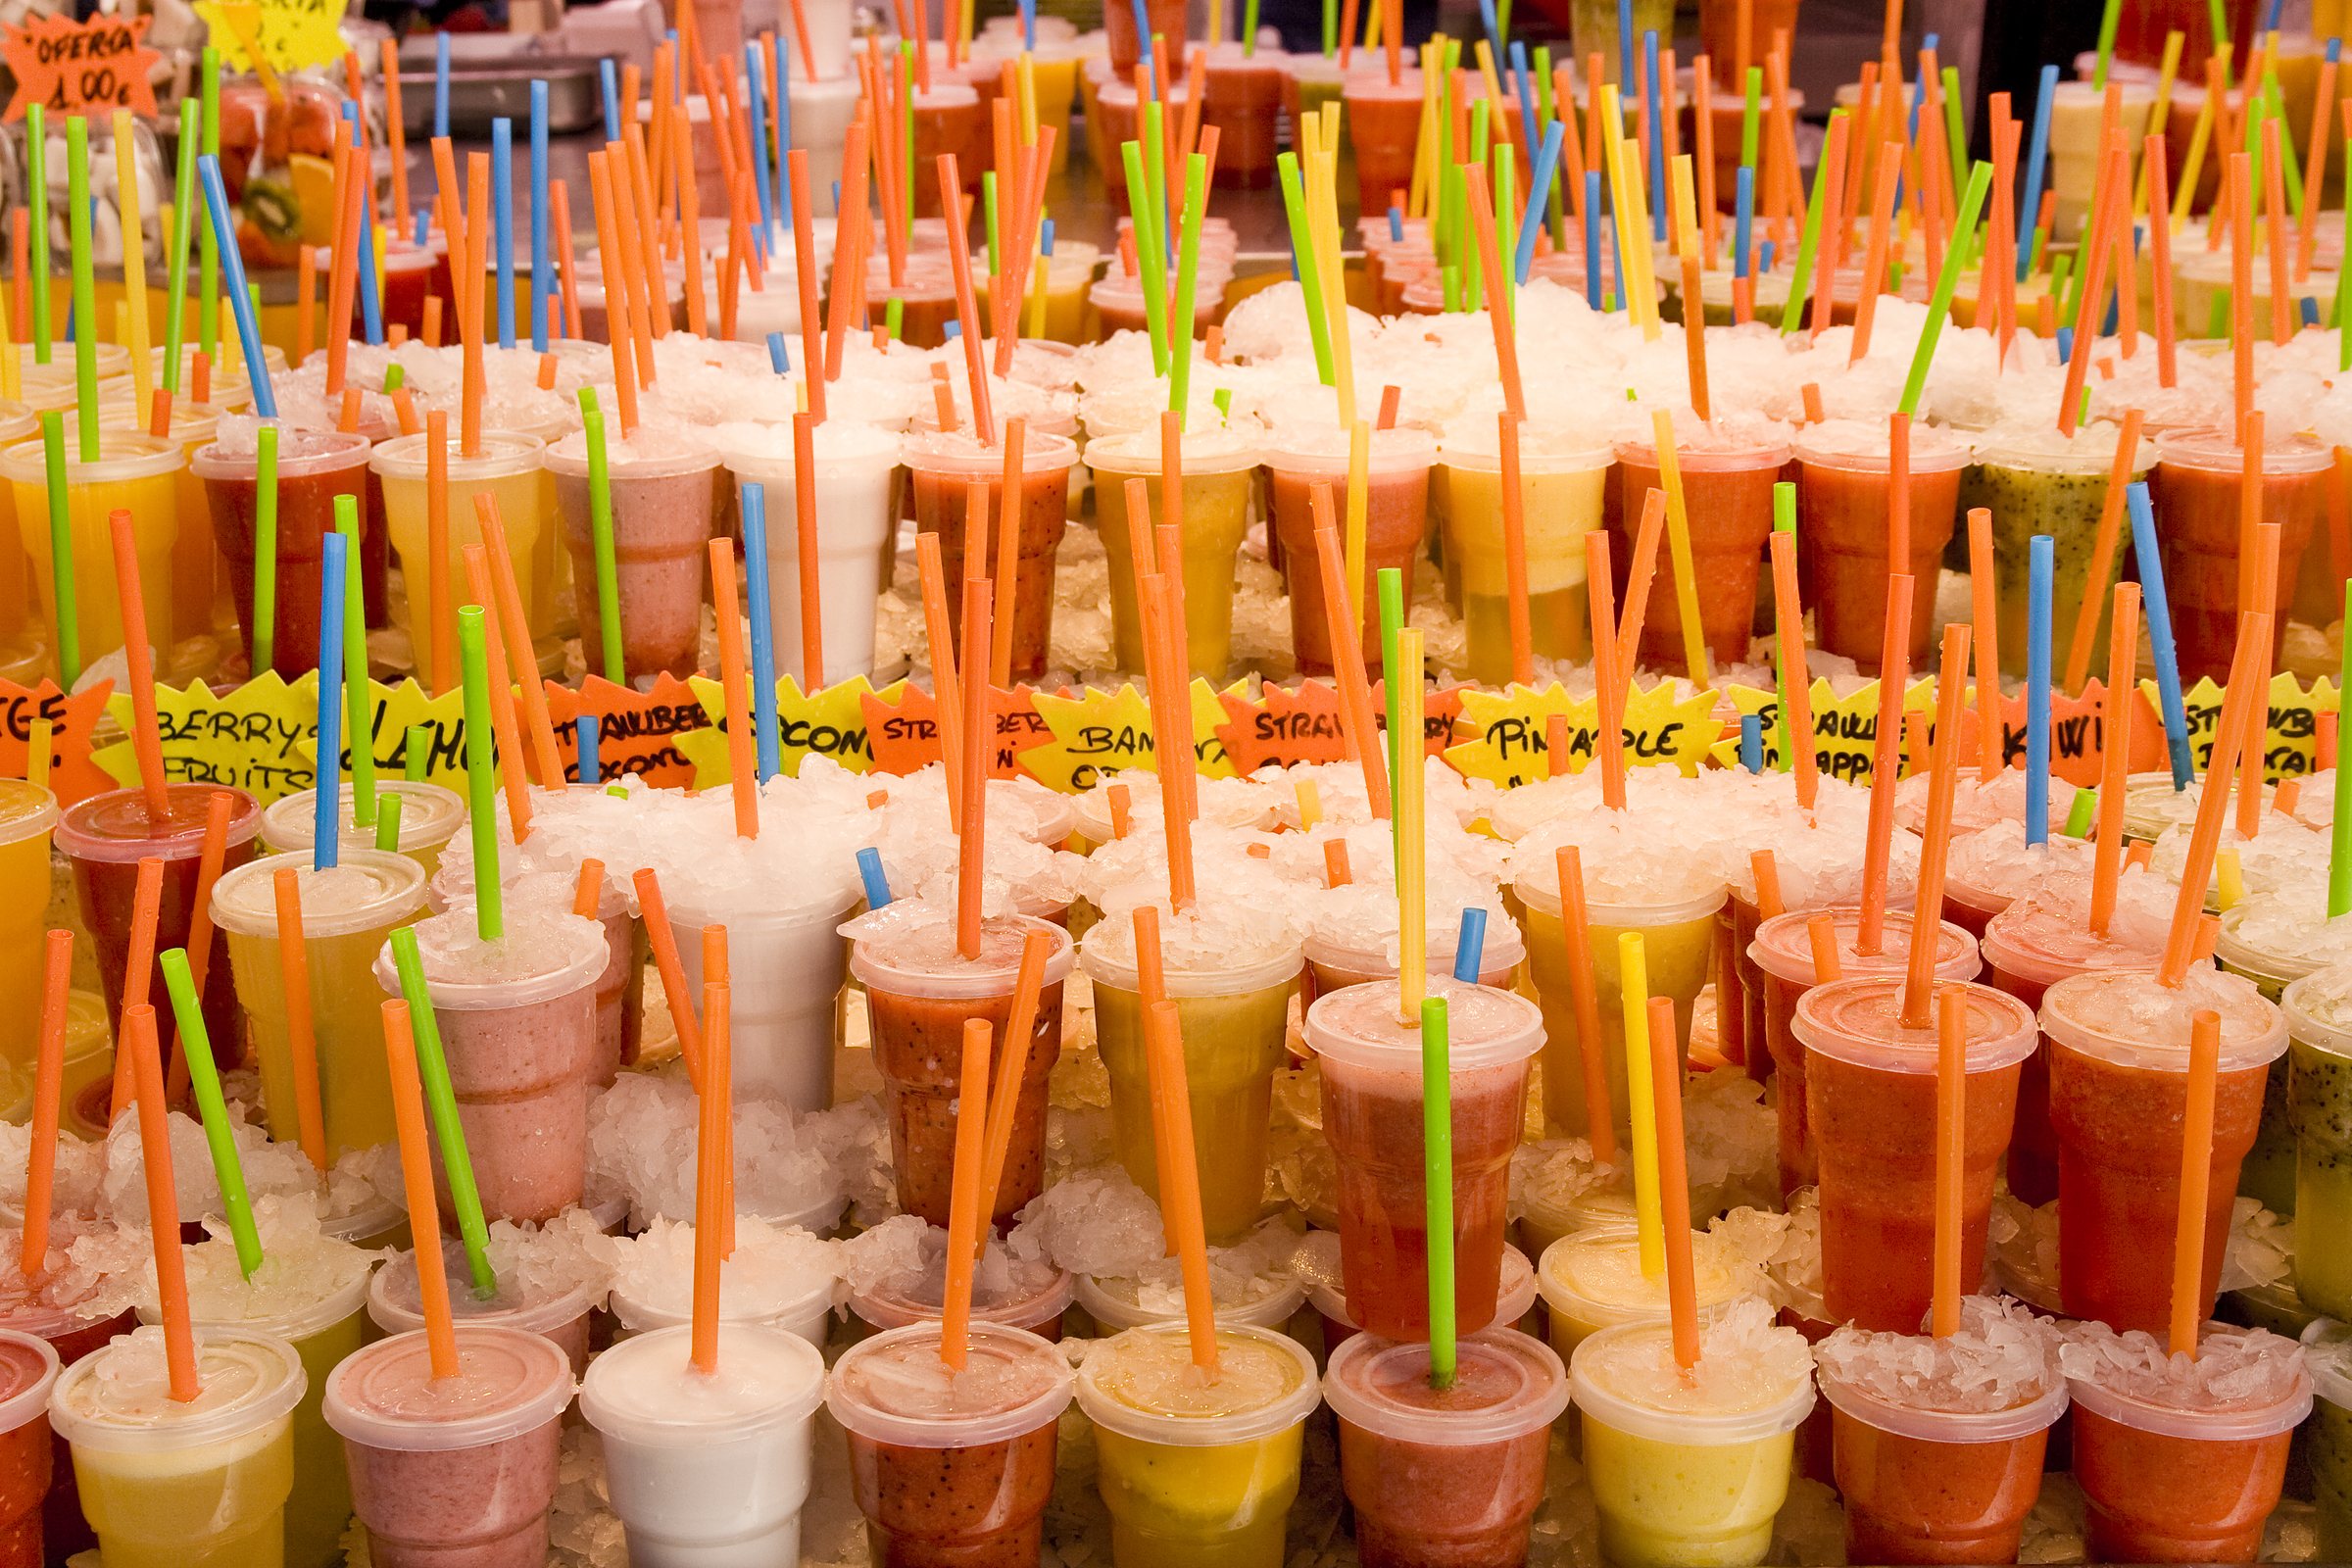
Juices and smoothies on ice at a stall in the Mercat de la Boqueria, Barcelona, 2009. The cup is this chapter’s unit: one $6.25 ticket, priced at 30 percent cost of goods. Photo: Bert Kaufmann, CC BY 2.0, via Wikimedia Commons.

The per-cup model

The modelled ticket is $6.25 pre-tax, with a $5.49 floor price, which sits at the low-middle of the local drink-price ladder rather than above it.1 At 30 percent cost of goods, one cup contributes $3.87 after processing fees. Processing takes 8.1 percent of revenue on a single-cup ticket, right at the studio’s ceiling, and falls as baskets grow.2

Table 7.1Where a $6.25 cup goes. CAD, single-cup ticket, 30% COGS.

Line$
Cup price, pre-tax6.250
Charged incl. 13% HST (remitted)7.063
Processing (2.9% + $0.30 on gross)0.505
Cost of goods (30%)1.875
Contribution per cup3.870
The same cup, drawn to scale.
Charged, with 13% HST: $7.063Cup price, pre-tax: $6.250$3.870Contribution$1.875Cost of goods, 30%Processing $0.5052.9% + $0.30 on the grossHST $0.81313%, remittedBreak-even: $450 a month of fixed costs ÷ $3.87 a cup = 116 cups a month, 3.8 cups a day.
Figure 7.1One single-cup ticket at 30 percent cost of goods. The shopper pays $7.06 with HST, which the store remits; processing takes $0.51 on the gross and cost of goods $1.88. The $3.87 left is what pays the fixed costs and, after them, the capital.Table 7.1; note 2.

Fixed costs run $450 a month: power including refrigeration and climate, connectivity, insurance, consumable service. No rent is charged in the model, because the structure was already held; a third-party operator should add theirs. No labour is charged, because the format bans it, and the check cuts the other way: one loaded minimum-wage part-timer, at roughly $2,800 a month, exceeds the entire floor-case revenue line.2 Break-even is $450 divided by $3.87: 116 cups a month, 3.8 cups a day.

Volume scenarios

Table 7.2Monthly net by volume and COGS. CAD, 30.4 days/month.

Cups/day28% COGS30% COGS32% COGS
12 (floor)1,007962916
30 (base)3,1933,0792,965
45 (stretch)5,0154,8444,673

Capital, fully totalled

The machine-only frame flatters the format. A $15K machine at the 12-cup floor pays back in 15.6 months, inside the study’s 18-month comfort line.

But the machine needs a structure around it. The structure’s buildout, priced to the fastener in the program’s bill of materials, runs $17,638 for the walk-in-vestibule configuration and up to $23,720 for the serving-window configuration, permits and contingency included.3 Total capital for the smallest real configuration is about $26,000; with the component build at the top of its range, $37,600.

Months to pay back four capital stacks, across demand. The curves only flatten well right of anything ever measured.
months to payback012243648607210203040cups per day6.8 measured best12 floor case30 base24-month kill line$60K platform tier$37.6K vestibule + DIY high$26K vestibule + DIY low$15K machine only

At the 12-cup floor, only the machine-only frame clears 18 months; the vestibule stacks run 2.2 to 3.3 years and the platform tier 5.2. In the shaded band, at or below measured demand, no total-capital stack pays back inside six years.

Figure 7.2The payback surface, with the category’s measured best and the study’s thresholds marked. The shaded band is demand at or below the measured line; curves are undefined where net margin approaches zero.Model: this chapter’s tables (contribution $3.87/cup, fixed $450/mo). Reference lines: ch. 03 (6.8 measured); the program’s kill criteria (12 floor, 24-month line).

Table 7.3Payback in months, 30% COGS, total capital.

Stack@ 12/day@ 30/day@ 45/day
$15K machine only (the flattering frame)15.64.93.1
$26K vestibule + component build, low27.08.45.4
$37.6K vestibule + component build, high39.112.27.8
$60K platform tier62.419.512.4

The program’s own kill line was 24 months. Winter makes it worse: at 60 percent cold-month volume with no hot menu line, the floor case’s annualized net falls by about a quarter.2

Then apply chapter 03

Every number above still assumed the floor case: 12 cups a day, every day, from a walk-up window. The category’s best measured operator, mature, in a captive venue, with a decade of iteration behind the machine class, serves 6.8. The floor case is not conservative; it requires beating the category’s best documented steady state by 75 percent from a cold start. The 30 and 45 cup columns, where the larger stacks become rational, have no measured comparable anywhere in the public record.

The model fails on demand, not margins: left of the measured line, no total-capital stack pays back inside six years, and the counted evidence that would move the model right of it does not exist.

Notes

  1. Local price ladder surveyed 2026-07-13/14 across chain menus in the trade area: the modelled $5.49 floor undercuts every found comparable line; $6.25 sits between mid-ladder chain prices. Ontario bubble-tea range roughly $5–8, premium lines to $8–12.
  2. The program’s unit-economics model, recomputed independently at close-out from first inputs (ticket, HST, processing 2.9% + $0.30, COGS 28/30/32%, fixed $450/mo, 30.4 days/mo), July 2026. Winter sensitivity modelled at 60% volume (no hot line) and 80% (hot line) for November through March.
  3. Buildout bill of materials, July 2026: walk-in vestibule configuration $17,638 all-in (60A panel variant); serving-window configuration to $23,720 (100A variant); both include a 12% contingency on physical goods and $2,040 of permits and fees.
The building and its paved lot seen almost straight down from above, delivery trucks parked along one side

Chapter 08

Site circulation

A walking customer cannot reach the rear structure without crossing the lot’s vehicle circulation. That caps what the building can hold. It is the narrowest finding in this study, a bound on one 240 square foot structure, and it is not the reason the program closed.

In this chapter

  1. 8.1What the geometry caps

At a glance

240 sq ft
the rear structure, 12 by 20 feet
3
curb cuts: one on Barton, two on Dewitt
0
walking routes that stay off the vehicle plane

The lot from above, April 2025. The finding of this chapter is about the paved plane around the building. Site photography, the study’s own archive.

The circulation bound, drawn: the vehicle plane wraps the building on three sides, and every walking route to the rear structure crosses it.
Barton St EDewitt RdNo. 520: two storeys, three service baysNo. 5203 baysRear structure, 12 by 20 feetrear structure90 ft160 ftsignalized intersection · 21,000+ vehicles a day, as listedNexisting twin baysgully, no vehicle pathwalk-up, Barton sidewalk-up,Dewitt sidewalk-up route crosses the vehicle planeevery walk-up route to the rear structure crosses it
Figure 8.1The circulation finding. Vehicle plane shaded: the north apron in front of the bays, the east corridor and the rear lot, entered from the two Dewitt cuts and the Barton cut; the strip west of the building is a gully with no vehicle path; walk-up approaches dashed; conflict points marked.Site-plan analysis from the 2007 Ontario Land Surveyor site plan of the parcel (on file), the study’s aerial photography (April 2025) and ground photography (December 2024 and April 2025), and the owner-side account of the lot’s circulation; schematic, approximate scale.

The lot’s vehicle circulation is fixed by its geometry. Dewitt carries the entries: two curb cuts, the first just south of the corner, the second further down, with a third cut on Barton.1

The strip west of the building is a gully with no vehicle path, so everything on wheels wraps the building’s north, east and south sides: the apron in front of the twin Barton-facing bays, the east corridor, and the rear lot. Vehicles queue on the apron in front of the bays at exactly the hours a walk-up store wants customers.

The rear structure stands at the south-west of the lot, on the far side of that vehicle plane from both sidewalks. Trace any pedestrian path from the Barton sidewalk or the Dewitt sidewalk to the rear structure and it crosses the vehicle circulation area; the gully rules out a third approach. The geometry offers no route that does not put a walking customer and a moving or queued vehicle in the same plane.

Ground-level view across the paved lot toward the rear of the service building, with the parking apron and fence line visible
Figure 8.2The vehicle plane at ground level, from the rear lot looking north, April 2025. The courier truck is parked against the blank south wall. This is the plane a walking customer must cross.Site photography, the study’s own archive.
Low aerial of the corner lot from the north-east: the service building, its north apron and east corridor, and the small grey rear structure at left
Figure 8.3The lot from the north-east, April 2025. The north apron and the east corridor wrap the building; the rear structure is the grey shed at left. Everything between it and either frontage is vehicle plane.Site photography, the study’s own archive.
The twin service bays on the building’s Barton face, photographed from the apron
The building’s long east face, a single bay door at its south end, with vehicles parked against it
Figure 8.4Two faces of the building, December 2024. Left: the twin Barton-facing bays, from the north apron. Right: the east face, its third bay at the south end, vehicles parked against it on the plane a walking customer must cross. Signage in both frames is the prior tenant’s.Site photography, the study’s own archive.
The small rear structure with its roll-up door beyond a row of parked cars, the service building’s east face and bay door at right
Figure 8.5The subject itself, December 2024: the 12 by 20 foot rear structure at the lot’s south-west, beyond the parking row and the rear apron; at right, the south end of the building’s east face and its third bay. Everything between the structure and either sidewalk is the vehicle plane of Fig. 8.1.Site photography, the study’s own archive.

What the geometry caps

The consequence is a cap, not a demolition: in the lot’s current configuration, rear-structure uses that require the public to walk in are out. Uses that do not, such as storage, service functions, or equipment, are unaffected. A customer-facing use sited in that structure would have to move the vehicle plane, the walking route, or the store.

All three are engineerable, and the standing to attempt them was already in hand: the property is held by an entity related to the studio’s founder, as disclosed at the front of the study, and the rear structure and the lot area in front of it sit outside the leased premises.2 Re-routing circulation was a question of cost and sequencing.

It was also not the question that decided anything. What closed the program is in chapters 03 and 07 and Appendix D: measured category demand below the model’s floor, total capital that does not pay back inside the kill line, and better-funded operators who had already run the experiment and lost.

Notes

  1. Analysis of the study site’s own plan geometry: lot and frontage dimensions from a 2007 Ontario Land Surveyor site plan of the parcel (on file) and as published at 520barton.com; bay positions and rear-structure position from the study’s aerial photography, April 2025, orientation fixed by the source files’ camera-heading EXIF, and its ground photography of December 2024 and April 2025. The two Dewitt entrances and the gully are the owner side’s account of the property. The walk-up finding is the studio’s own site-plan analysis.
  2. The standing noted above: the rear structure and the lot area directly in front of it are outside the leased premises and under the owner side’s control. The lease is on file; its terms are not reproduced here. The studio’s founder is on the owner side, as disclosed at the front of the study.
A wide aerial view of the corner and the surrounding neighbourhood under an overcast sky, the escarpment on the horizon

Chapter 09

Verdict, and what transfers

Unattended fresh-drink retail fails on demand per machine everywhere it has been measured, and the cost of proving otherwise exceeds the return available. Several far better-funded operators established that before this program began.

In this chapter

  1. 9.1How it closed
  2. 9.2What transfers
  3. 9.3What was never proved
  4. 9.4What would reopen the question

At a glance

Kill
the verdict, in full
≈ $0
venue capital consumed by the 76-day program
3
conditions recorded at close that would reopen the question

The corner and its neighbourhood, the escarpment on the horizon, April 2025. Site photography, the study’s own archive.

Verdict, in full: kill. The cost to prove this model, across prototyping, development, marketing and selling it, exceeds what it returns at any demand anyone has measured.1

The smallest real capital stack is about $26,000 to $37,600 and pays back in 2.2 to 3.3 years against a 24-month kill line, and it needs 12 cups a day to do it. The category’s one measured throughput figure is 6.8, from a mature unit in a captive indoor venue, at an operator whose disclosed economics are a venue service fee alongside the retail line rather than cup margin alone.

The category is contested and its distribution is owned: the leader’s placement runs on the vending industry’s existing procurement rails, the region already carries operators, and the better-funded entrants ran this experiment first and lost.

The site is not the reason. Its exposure is real and independently priced, its zoning is permissive, and the rear structure’s walk-up cap is a bound on one 240 square foot building that the owner side had the standing to engineer around. The viable expressions of the work are venue-placed units, on the service-fee economics the category runs on, and the platform itself.

How it closed

Each concept in chapter 02 died against a named criterion or a falsified premise, or closed with the site, and the evidence that closed the remainder was public and free the whole time. The category’s own record had already been written by operators with more money: Appendix D holds the roster.

An entrant with US$26 million of stock and note sales on file, hundreds of times what this program would ever commit, was acquired by a beverage incumbent. A US$3.5 million crowdfunded entrant closed without ever advancing past prototypes and trade-show demos. A robot bubble-tea shop opened in March 2024 and closed in 2025.

The demand ceiling of chapter 03 and the capital arithmetic of chapter 07 then said the same thing in this program’s own numbers, and the program’s founder closed all venue exploration the same day the last reuse was falsified. The circulation finding of chapter 08 landed the same week; it caps one structure, and it moved none of the arithmetic.

Venue capital consumed by the 76-day program: approximately zero. Nothing physical was bought for the structure, no permit was filed, no machine was ordered. The spend was bench hardware and domain renewals.

What transfers

The platform. A production payments and inventory system with four money paths, idempotent state machines, reconciliation convergence, receipts, and a 71-check adversarial test record; it charged a live purchase on production rails. It is venue-independent by construction.

The edge pattern. A validated recipe for on-device store intelligence: a small language model and speech-to-text co-resident on a $250-class computer, sub-4-second voice in the common case, with the cloud as ledger of record. The same architecture serves any deployment where compute must live on site.

The method. Kill criteria before capital, primary-source verification of load-bearing claims, and the one amendment this program earned: read the category’s own record, and price what it costs to prove the model, before building the model. Appendix C states it in full; it is the studio’s standing operating procedure.

What was never proved

The market. No store ran on the platform and no shopper used it in the wild: the pre-launch lockdown never lifted, and the venue closed before the counting protocol ran. The close-out state is launch-ready engineering with no market evidence. The program falsified each venue for testing the platform but never the platform as a business.

What would reopen the question

Three conditions were recorded at close. An inbound placement request from a venue relationship formed during the program; no outbound motion reopens the file.

Or counted demand, measured somewhere real, clearing the floor case with the total-capital arithmetic closing inside the 24-month line: that is the first gate now, and no parcel reopens the file on its shape, because the shape of a parcel was never what failed. Or a need for the unattended-retail stack as a hardware testbed, in which case the store becomes the harness rather than the business. Absent one of these, the park is permanent.
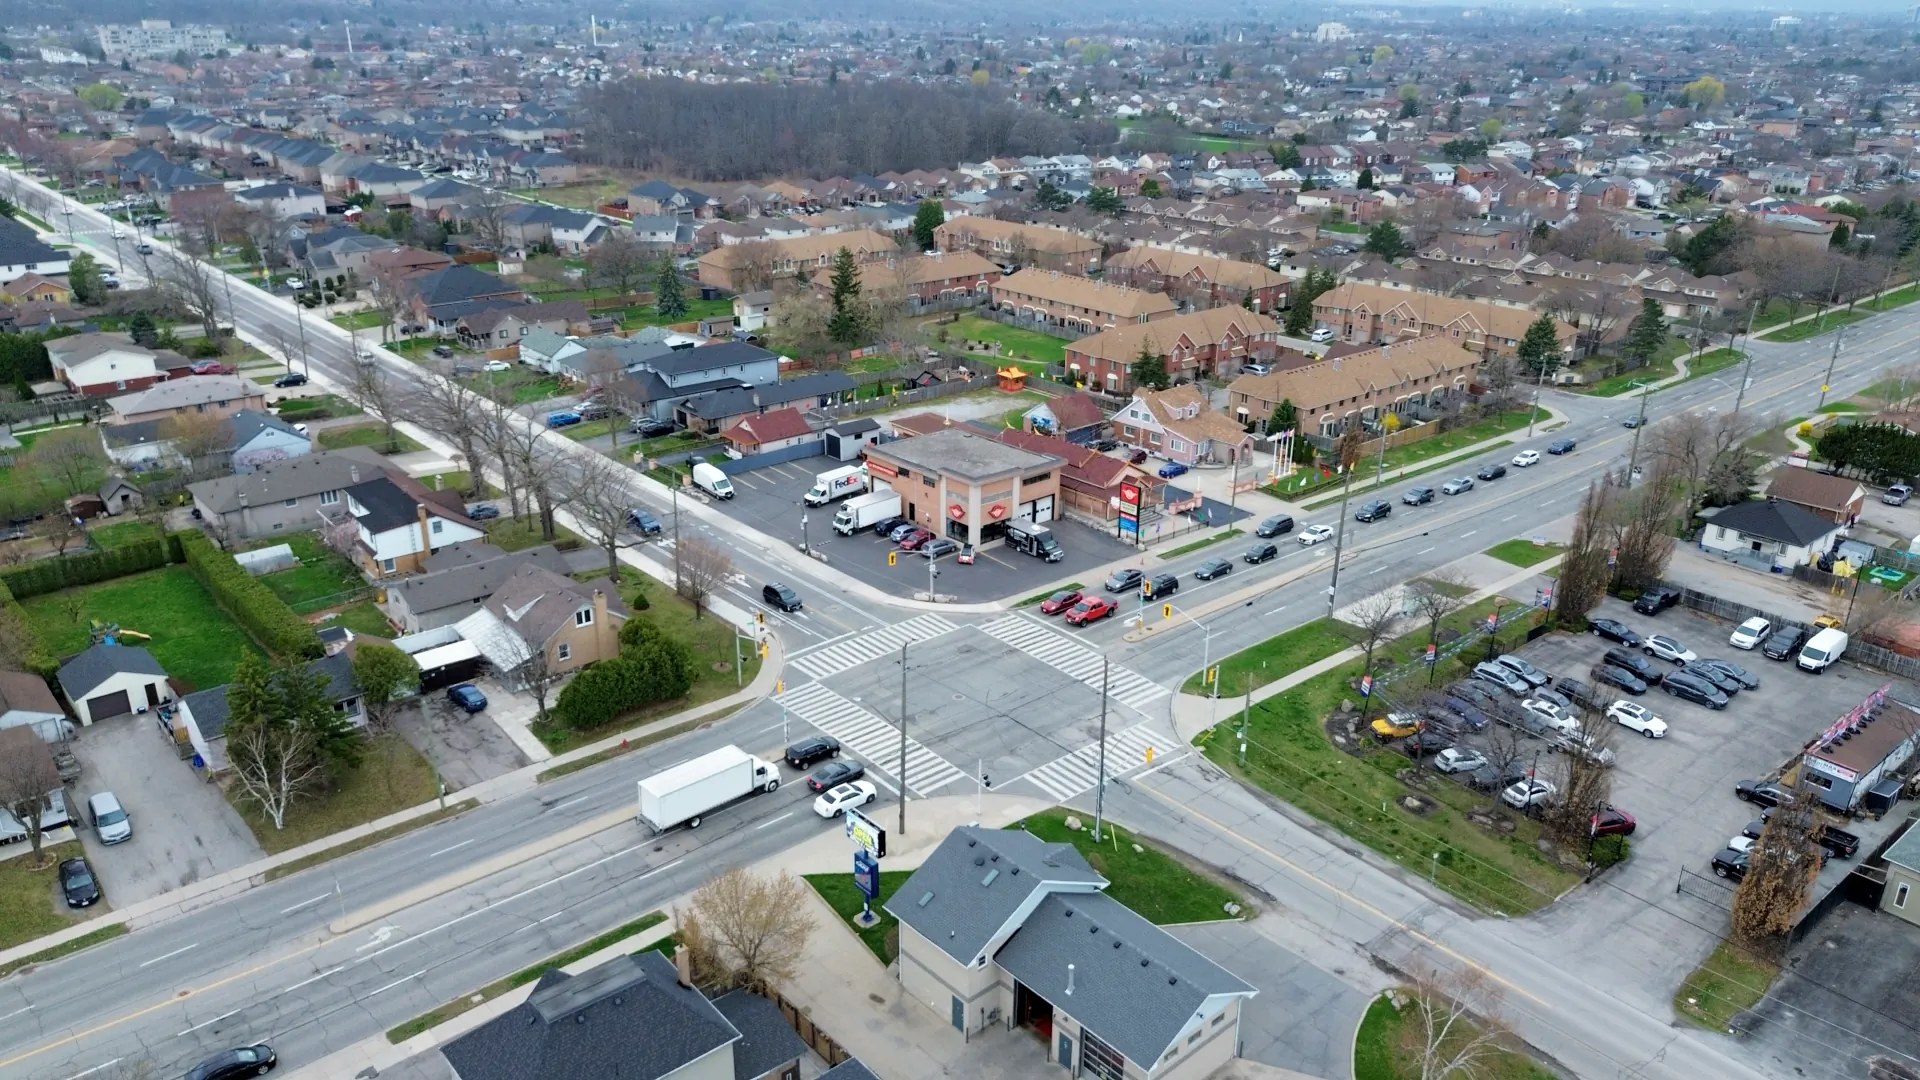
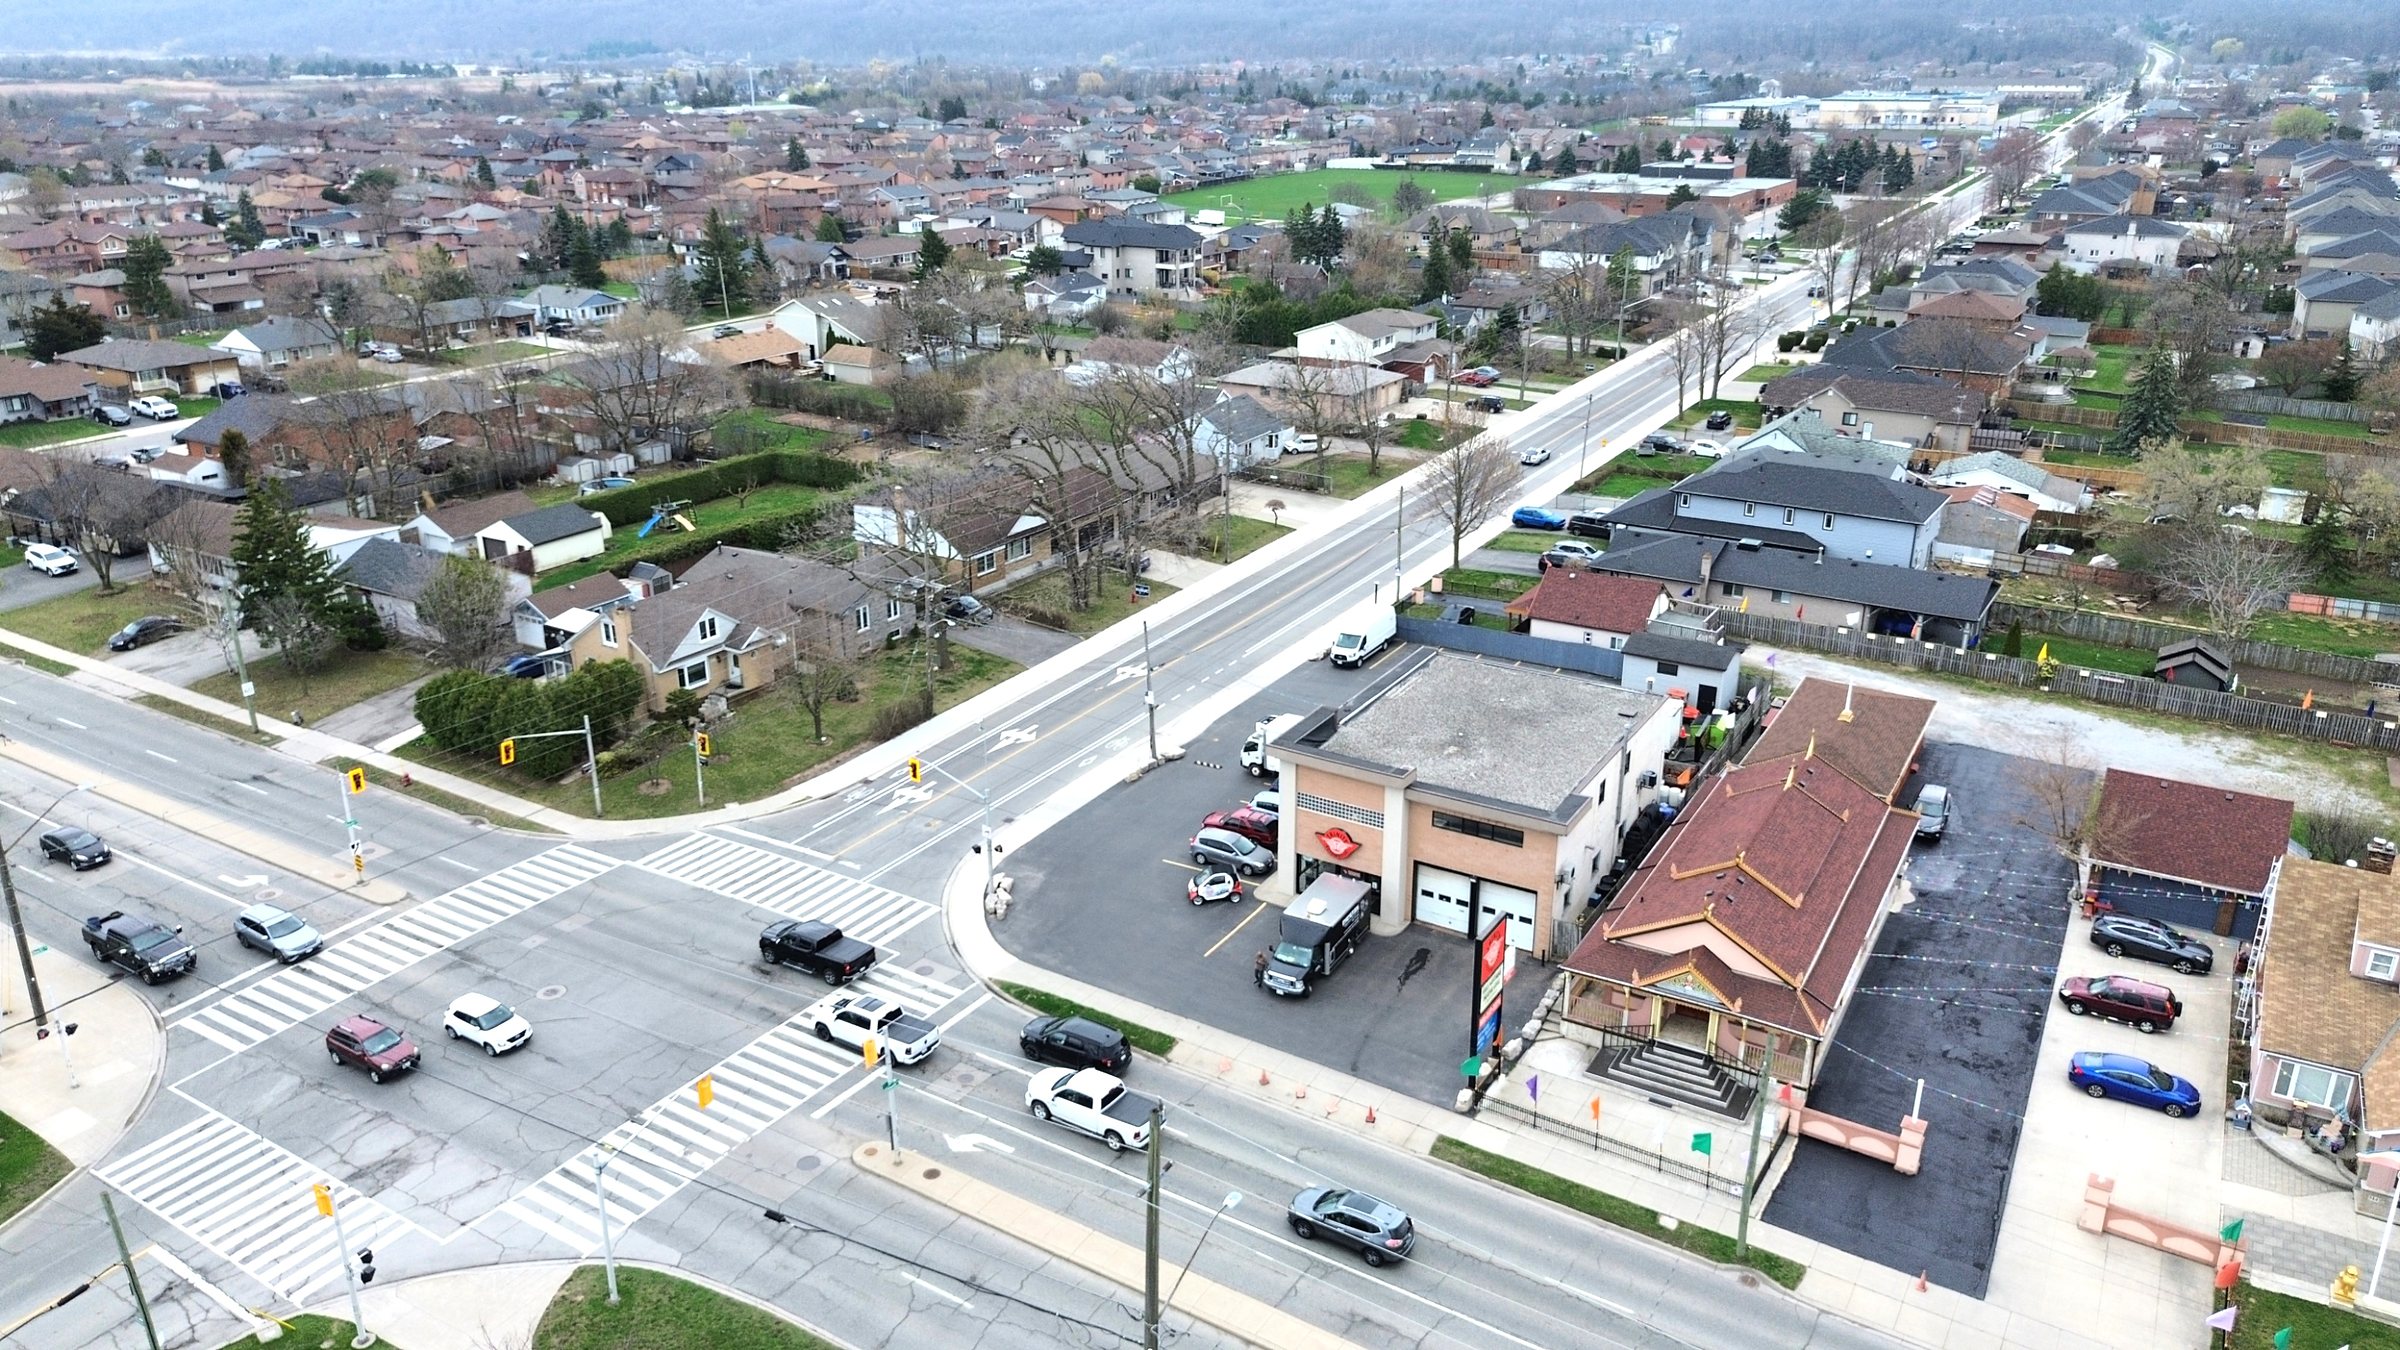
High aerial of the Barton Street East and Dewitt Road junction, the corner building and its lot at centre, townhouse blocks behind and an industrial strip along Barton to the right
Figure 9.1The corner, looking west along Barton Street East, April 2025.Site photography, the study’s own archive.

Notes

  1. Close-out record of the program, July 14, 2026: verdict, capital accounting, transferring assets, and revival conditions as filed in the program ledger. The same record carries what was never proved: zero stores onboarded across the program’s life, the public lockdown never lifted, and the cup-count protocol written but never run. Category figures in this chapter are sourced in chapters 03 and 07 and Appendix D.

Appendix A

Timeline

Every dated entry below is anchored to the program’s ledger, its git history, or a filed record. The pre-repository months are narrated without invented specifics.

Seventy-six days, April 30 to July 14, 2026.
JuneJulyEdge spike, June 3 to 9Founding commitWalk-in registershipsPivot:register-firstPayments spine,in one dayDestruction pass:48 checks heldEvery money pathlive, test modeUnattended loopshipsBench proof onhardwareFirst live dollar,$1.99Doctrine written; drinkprogram specifiedThe evidence closesthe questionApr 30Jul 14
Figure A.1The program’s dated milestones from Table A.1, on one line. The lease and possession of the pre-repository months come before the axis.Program ledger and git history.

Table A.1The site and the program, in date order.

DateEvent
Nov 2025Lease executed on the property; the main building is let to the operating tenant. The rear structure and a slice of the lot are outside the leased premises.
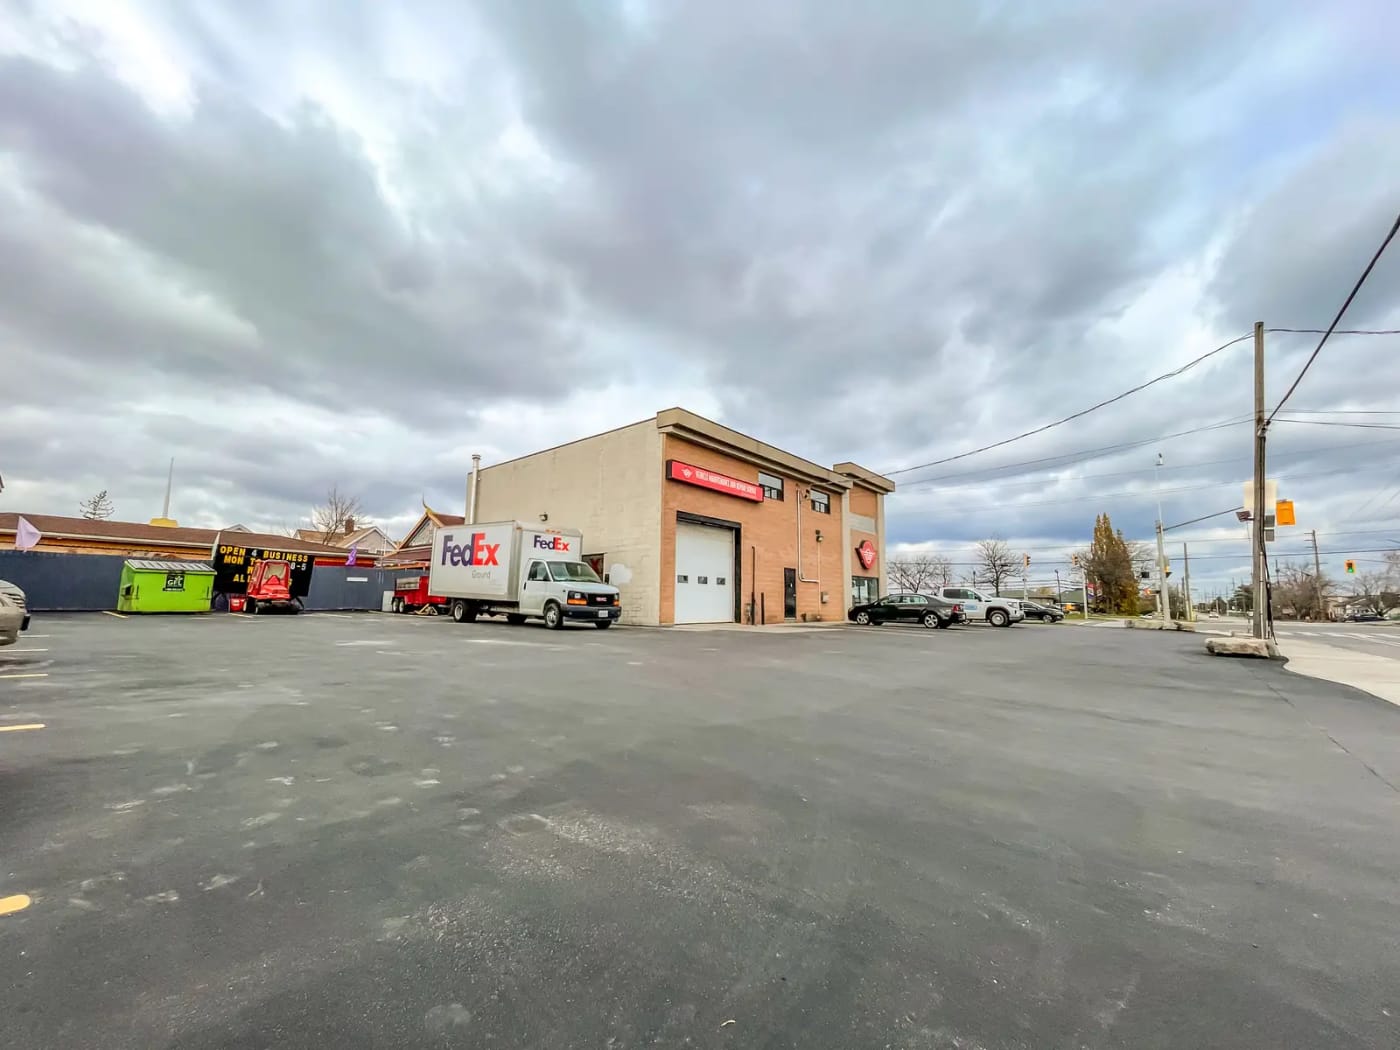
Jan 2026Possession and fixturing begin under the new tenancy.
Spring 2026Concept work begins on what the site’s unleased remainder could carry. The pre-repository months are concept phase; no artifacts survive from them, and none are invented here.
2026-04-30Founding commit of the software platform.
2026-05-13The walk-in register ships: cash and card ring-up, end-of-day closeout.
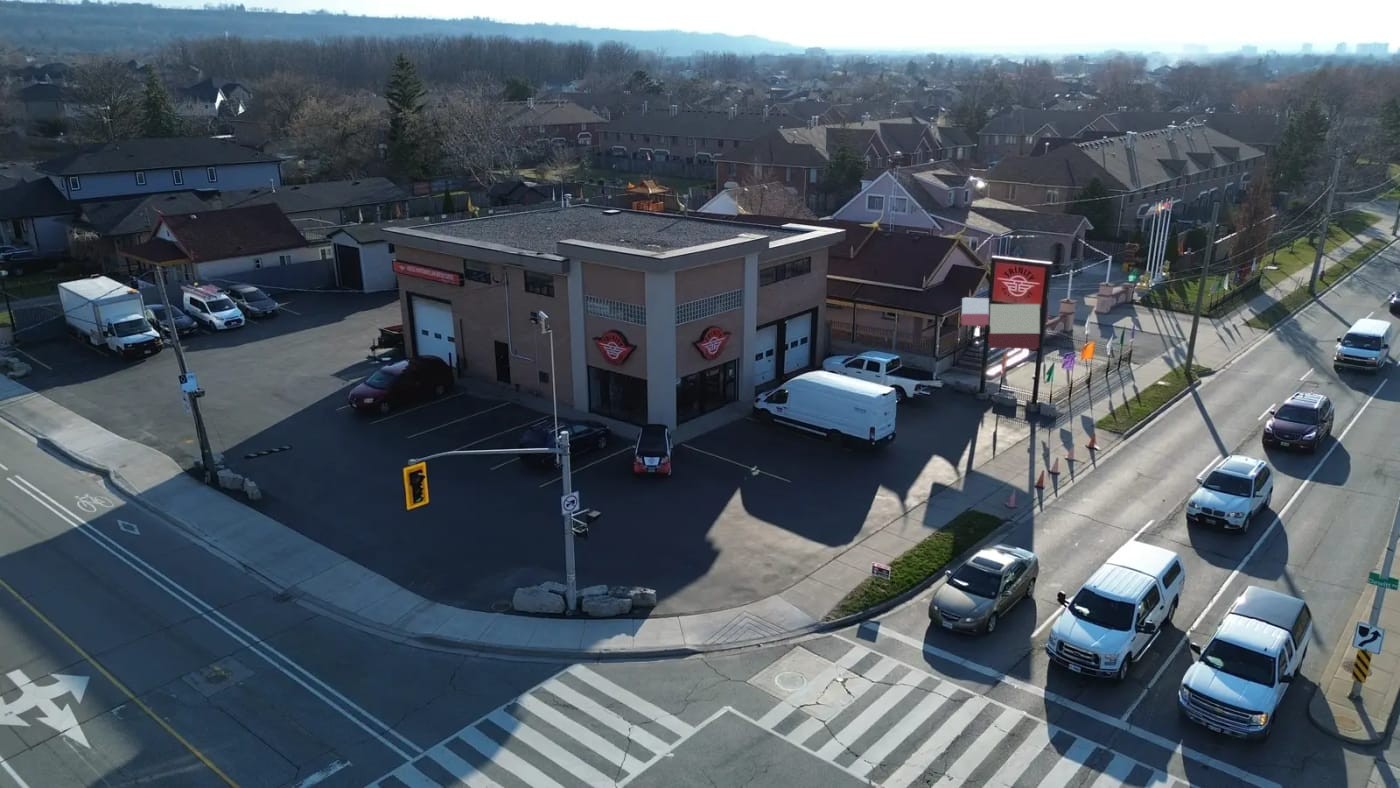
2026-05-25Strategy pivots register-first; two days later the posture hardens to no partial rollout, test to destruction before any real user.
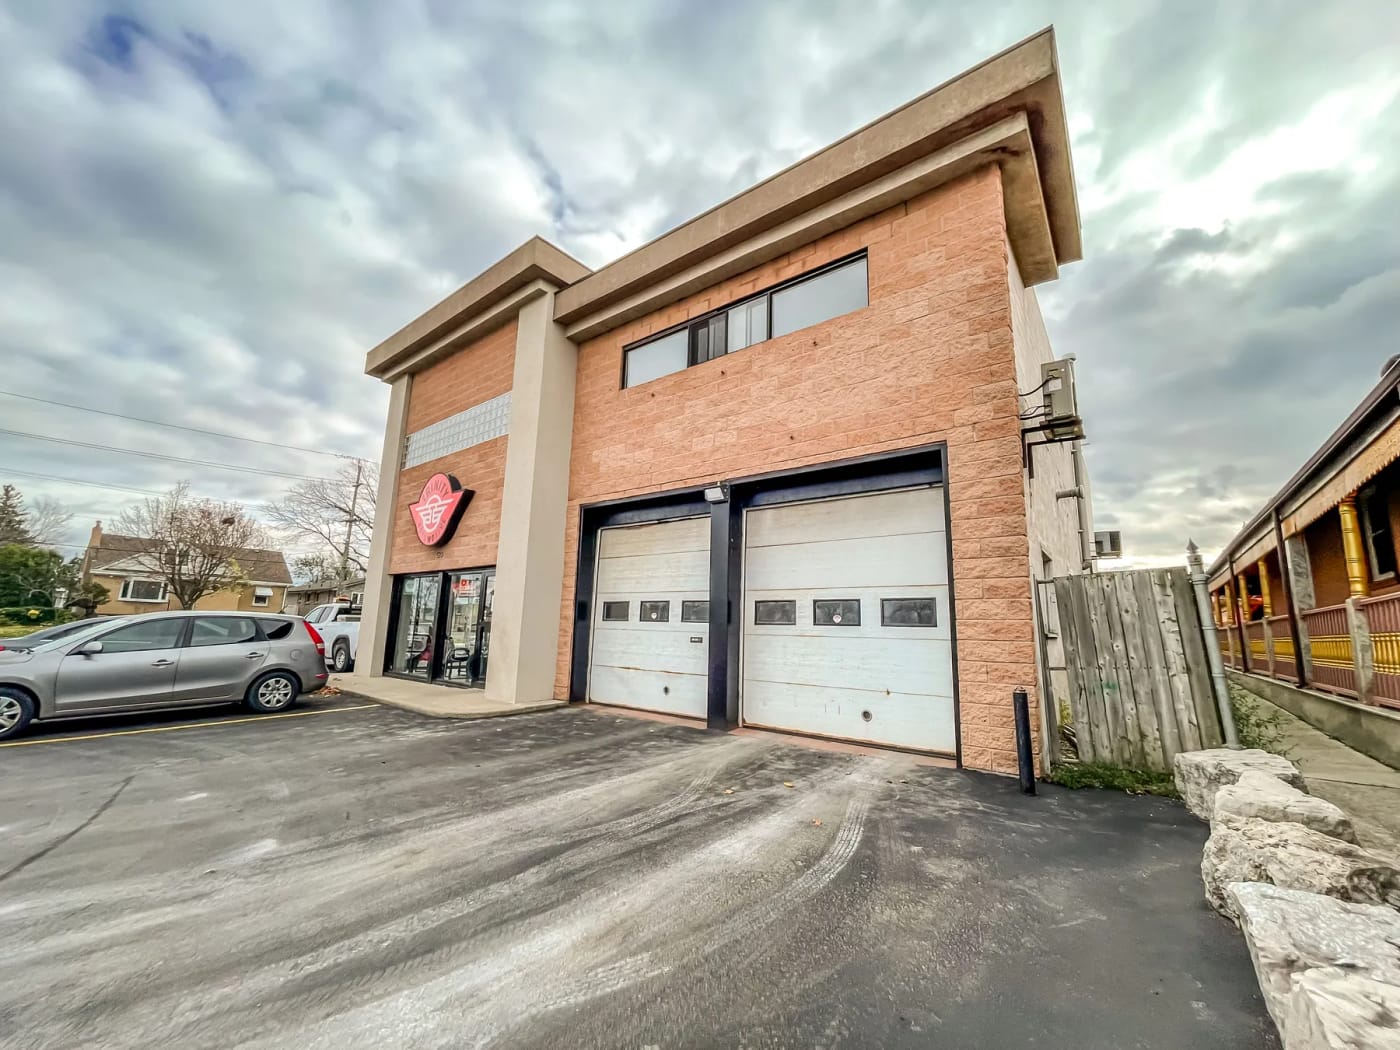
2026-05-28The payments spine lands in one long day: processor onboarding, terminal simulator, admin authentication with an append-only audit log, and the first chaos harness.
2026-06-03 to 06-09Edge hardware spike: a 3B language model and speech-to-text co-resident on an 8 GB edge computer; voice under the 4-second bar for the common case. Validated, then deliberately parked.
2026-06-10The bulletproofing capstone: two-phase terminal refunds, the reconciliation backstop, and the 48-check destruction pass. All scenarios held.
2026-06-12All money paths verified live on deployed infrastructure, test mode, end to end.
2026-06-30The unattended loop ships: session, charge-on-exit, inventory decrement, receipt.
2026-07-06First full bench proof on physical hardware: a real session rung up and closed by a single-board computer driving a real lock, still test mode.
2026-07-09First live dollar: a $1.99 phone-wallet purchase charged on production rails and refunded by hand from the processor’s dashboard.
2026-07-13The studio’s doctrine is written down. The drink program is specified to the fastener: hypothesis, seven kill criteria, market calendar, machine assessment, buildout bill of materials. The staffed variant is rejected the same day.
2026-07-14The evidence closes the question: the category autopsy and its measured demand ceiling (chapter 03), the landed-cost falsification (chapter 05), the total-capital arithmetic against the 24-month kill line (chapter 07), and the category’s own record of better-funded operators who lost (Appendix D). All venue lines are closed. The record is filed the same day. The circulation finding (chapter 08) lands the same week: a bound on one structure, not a cause.

Appendix B

Sources

Every external source cited in the study, grouped by chapter, with access dates. Figures reported “as listed” are the listing party’s own numbers, noted where the source was not directly fetchable at access time.

The site (chapter 01)

  1. 520barton.com, the property’s management site: lot and building dimensions, zoning and permitted uses, transit routes, highway distances, tenancy. Accessed 2026-07-14 and 2026-07-15.
  2. LoopNet listing 35028900 (loopnet.ca, 520 Barton St, Hamilton): 21,000+ daily vehicles, as listed. Direct fetch returned HTTP 403 on 2026-07-15; figure reported as listed.
  3. Vendo Media, 521 Barton Street digital billboard: 21,034 daily impressions, as listed by the vendor. Per-board page not directly fetchable 2026-07-15; vendomedia.co consulted the same day.
  4. City of Hamilton open data was searched for a junction traffic count (open.hamilton.ca, ArcGIS Hub API), 2026-07-15; no citable dataset was found and no estimate is substituted.
  5. Site plan of the parcel by an Ontario Land Surveyor, 2007, on file: lot and frontage dimensions and the building’s position, used for the plans of chapters 01 and 08.

The concept space (chapter 02)

  1. City of Hamilton Building Permit By-law 15-058 (change-of-use permits); Ontario Building Code, Group A-2 assembly occupancy and its washroom and barrier-free requirements. As assessed in the program’s close-out record, July 2026.

Category analysis (chapter 03)

  1. Ottomate News, founder interview: ottomate.news/p/zenblen-brings-robo-crafted-smoothies. Accessed 2026-07-14.
  2. mHUB blog, published 2022-05-23: mhub.org/blog/hardtech-startup-zenblen-inspires-healthy-consumption. Accessed 2026-07-14.
  3. IIT Institute of Design, published 2020-11-05: iit.edu/news/smoothie-making-finds-its-zen-institute-design-students. Accessed 2026-07-14.
  4. zenblen.com (homepage, find-a-kiosk, our-technology). Accessed 2026-07-14.
  5. Venue hours and access pages: rush.edu, lib.uchicago.edu, mhubchicago.com, rentnemachicago.com, onyxpilates.com and others. All accessed 2026-07-14.
  6. The Daily Northwestern, 2026-05-26: dailynorthwestern.com/2026/05/26/campus/second-zenblen-smoothie-machine-installed-in-main-library. Accessed 2026-07-14.
  7. Northwestern Now, April 2018 (campus dining contract): news.northwestern.edu. Accessed 2026-07-14.
  8. The DePaulia, 2025-01-20 and December 2025 (vending contractors): depauliaonline.com. Accessed 2026-07-14.
  9. DePaul demon-discounts page (kiosk discount code): resources.depaul.edu. Accessed 2026-07-14.
  10. College of DuPage vending procurement solicitation, June 2025: cod.edu (PDF, via search snippet). Accessed 2026-07-14.
  11. Canteen self-description: canteen.com/about-us. Accessed 2026-07-14.
  12. SEC EDGAR, Zenblen, Inc., CIK 0001993331: Form D filed 2023-09-18; Form D filed 2026-01-21; two Sydecar-administered feeder SPV filings. All accessed 2026-07-14.
  13. mHUB HardTech Summit pitch video (uploaded 2026-03-25): youtube.com/watch?v=wW6zQRT78pA, 41:28 to 44:18, auto-captions. Accessed 2026-07-14.
  14. UChicago Polsky Center, 2025-06-11: polsky.uchicago.edu. Accessed 2026-07-14.
  15. Patents: US9579615B2, US10299628B2 (F’real Foods LLC); US10682942B2 (Tikiz Franchising, LLC); US20220160162A1 (Zenblen, Inc.); AU2015309631B2, USD805828S1, USD859904S1 (Tbot Inc.). patents.google.com. All accessed 2026-07-14; US20220160162A1 rechecked 2026-10-02.
  16. LinkedIn public profile: ca.linkedin.com/in/rehmanmerali. Accessed 2026-07-14.
  17. 6d bytes inc. (Blendid), FY2025 annual report, SEC EDGAR CIK 1830909, filed 2026-03-02. Accessed 2026-07-14.
  18. Built In Chicago company and job listings (labelled broker data where used). Accessed 2026-07-14.

Regulatory posture (chapter 04)

  1. O. Reg. 493/17 (Food Premises): ontario.ca/laws/regulation/170493 and canlii.org. Accessed 2026-07-14.
  2. Ontario Ministry of Health, Food Premises Reference Document, 2019, p. 18. Accessed 2026-07-14.
  3. City of Toronto DineSafe open dataset (104,790 records at access), parsed directly. Accessed 2026-07-14. DineSafe historical data, 2001 to 2023, and the current dataset as updated 2026-10-01, searched again for RC Coffee. Accessed 2026-10-02.
  4. rccoffee.com (locations, the Robo Cafe brand since 2021). Accessed 2026-07-14. Newsfile release of 2020-10-07 (the first kiosk). Accessed 2026-10-02.
  5. City of Chicago Socrata API: Food Inspections 4ijn-s7e5; Business Licenses r5kz-chrr. 26 queries, raw responses archived. Accessed 2026-07-14.
  6. Chicago Municipal Code §4-8-032 (automatic food vending machine operations), indexed text. Accessed 2026-07-14.
  7. Illinois Department of Public Health, retail food program (FDA Food Code 2022 adoption): dph.illinois.gov. Accessed 2026-07-14.
  8. 410 ILCS 625/3: ilga.gov. Accessed 2026-07-14.
  9. Conference for Food Protection, Unattended Food Establishments issue paper (2014 packet): foodprotect.org. Accessed 2026-07-14.

Automation assessment (chapter 05)

  1. Entrepreneur (Bobacino funding coverage), accessed 2026-07-14. SEC EDGAR, Future Pearl Labs, Inc. (Bobacino), CIK 1830113: Form 1-SA filed 2022-09-28 and Form 1-U filed 2023-12-07; Hubtas newsletter, 2024-01-30. Accessed 2026-10-02.
  2. Daily Hive (Tea Industries closure): dailyhive.com/vancouver/tea-industries-richmond. Accessed 2026-07-14.
  3. The Spoon, Axios (2020-01-07), Crunchbase News (Cafe X); Daily Coffee News (Briggo acquisition, November 2020). Accessed 2026-07-14. The Spoon (2021-01-21, Cafe X reopens at SFO); cafexapp.com/locations; SEC EDGAR, Briggo, Inc. (Forms D, 2012–2019). Accessed 2026-10-02.
  4. annorobots.com; winnsen.com; robotic-service.ld-auto.com; vendingconnection.com and almanacnews.com (Yo-Kai). Accessed 2026-07-14.
  5. botrista.com FAQ; thespoon.tech (Botrista model); techcrunch.com 2022-12-02 and getsmoodi.com aggregated pricing (Smoodi); hommy.com (HM160A). Accessed 2026-07-14.
  6. alibaba.com showrooms (boba-machine-robot; bubble-tea-machine). Accessed 2026-07-14.
  7. tariffnumber.com (HS 8476 headings); ghy.com (surtax scope); esasafe.com (field evaluation, fees revised 2026-04-01). Accessed 2026-07-14.
  8. nayax.com MDB glossary; oceanpayment.com (payment-rail context). Accessed 2026-07-14.
  9. Component sources: gofoodservice.com, dispensingcomponents.com, graco.com, arozone.com, lollicupstore.com, katom.com, globalresourcesdirect.com, webstore.ansi.org (NSF/ANSI 18). Accessed 2026-07-14.
  10. FX: 1 USD = 1.415 CAD, market range for the week of 2026-07-07, exchangerates.org.uk. Accessed 2026-07-14.

Platform, economics, circulation (chapters 06 to 08)

  1. The program’s own records: repository git history and close-out audit (2026-07-14), chaos-suite results, the unit-economics model, the buildout bill of materials, and the close-out ledger. Internal records; figures reproduced in the chapters are the audited counts.
  2. Local drink-price ladder: chain menu prices surveyed in the trade area, 2026-07-13/14.
  3. Site photography: the study’s own archive, ground photography December 2024 to April 2025, aerials April 2025. All images resized and stripped of metadata for publication.
  4. Bench photography and screen captures (chapter 06): the studio’s own hardware and surfaces, documented July 2026, after the production deployment was parked by disposition. On-screen QR codes in these frames resolve, deliberately, to this study rather than to a live checkout session, and capture-tool overlays were removed in processing. The kiosk software’s wordmark was retouched out of the screens. No production endpoint, payment session, or chargeable code appears in the published record. The July 9 live dollar is documented at Fig. 6.4.
  5. Third-party pictures are credited under each figure and listed in full in the picture credits at the end of the study. Photographs under a free licence, from Wikimedia Commons and Flickr, are used on that licence’s terms. Press photographs, marked as such in the picture credits, are reproduced at review scale for the purpose of review, each with its photographer or publisher named under it. The drawings of Fig. 3.4 are United States Patent and Trademark Office records. The maps are drawn from OpenStreetMap data (ODbL) and Natural Earth (public domain). A rights holder’s removal request to hello@craftpine.com is handled by deletion.

The category record (Appendix D)

  1. Entries draw on the sources listed above for chapters 03 to 05 and on these, checked in October 2026; all accessed 2026-10-02.
  2. Bobacino: SEC EDGAR, Future Pearl Labs, Inc., CIK 1830113, Form 1-K for 2021 (filed 2022-05-02: incorporation, the Wavemaker Labs studio), Form 1-SA filed 2022-09-28 (offering proceeds) and Form 1-U filed 2023-12-07; The Spoon, 2020-11-17 (the prototype); Hubtas newsletter, 2024-01-30.
  3. Tea Industries: Richmond News, 2024-03-26 (soft opening); Noms Magazine, 2024-03-25 (staff and timing) and 2025-12-13 (closure); Foodgressing, 2024-03-26 (the robot’s sequence); Daily Hive, 2025-12-22.
  4. Briggo: SEC EDGAR, Briggo, Inc., CIK 1539135, Forms D and D/A filed 2012-01-11 to 2019-08-23 (seven offerings of stock and notes, US$26,030,283 reported sold); Austin American-Statesman, 2011-12-02 (the founder) and 2020-10-30; CultureMap Austin, 2020-10-30 (five active kiosks, the rebrand); FER, 2018-05-01 (founding year); Texas business records via opencorporates.com (Briggo, Inc. renamed BC Wind-Down, Inc., 2020-05-05). Accounts differ. The Statesman gives a 2009 founding and about US$10 million raised, and the filings give 2011 as the year Briggo, Inc. was incorporated. Daily Coffee News gave US$19 million, the sum of the filings made through 2018; a 2019 amendment and a 2019 offering bring the total to US$26.0 million. The 2017 stock was paid for partly by converting bridge notes, so the total can count some money twice.
  5. f’real Foods: Rich Products release, PR Newswire, 2012-12-12 (founding, locations, the acquisition); f’real release, 2023-09-25 (the first blender, Tulsa, 2003); the 2019 verdict as in chapter 03, note 8.
  6. Blendid: SEC EDGAR, 6d bytes inc., CIK 1830909, Form 1-SA filed 2026-07-14 (paid-in capital at 2026-04-30, the going-concern wording), Form 1-K for FY2025 filed 2026-03-02 (balance sheet, going concern, staff, write-off, products) and for FY2022 filed 2023-02-28 (first kiosks, pilots, kiosks deployed); Entrepreneur, 2022-09-02 (kiosks in contract).
  7. Artly: SEC EDGAR, Blue Hill Tech, Inc., CIK 1936104, Form D filed 2022-08-08, Form C-U filed 2024-04-23 and 2026-05-04, Form C filed 2026-06-22 with FY2025 financial statements and the auditor’s report, and Form C/A filed 2026-09-18; nomsmagazine.com (MUJI Robson Street, Vancouver, 2024-01-15); blogto.com (MUJI, 20 Dundas Street West, Toronto, March 2024); tocityscapes.com (the Toronto counter, 2025-09-03); Google Maps listing, Artly Coffee, 20 Dundas St W, Toronto (3.7 of 5 from 12 ratings).
  8. teaBOT: ycombinator.com/companies/teabot; TechCrunch, 2015-07-23; U of T Engineering News, 2016-05-31 (locations, revenue-share kiosks); teabot.com/how-it-works (the office subscription).
  9. Cafe X: SEC EDGAR, Cafe X Technologies, Inc., CIK 1748775, Form D filed 2018-08-06 (US$9,420,709 sold; incorporated 2014) and Form C-U filed 2023-05-01 (US$319,548); TechCrunch, 2017-01-30; The Spoon, 2020-08-11 and 2021-01-21; Crunchbase News, 2020-01-07; cafexapp.com/locations.
  10. RC Coffee: Newsfile releases of 2020-10-07 (the first kiosk) and 2021-07-20 (the Robo Cafe brand; KioSoft Technologies as parent); rccoffee.com/locations (ten Robo Cafes); City of Toronto DineSafe historical data, 2001 to 2023, and the current dataset as updated 2026-10-01, searched by RC Coffee’s names and addresses (no record).
  11. Caffeo: 6ix Retail, 2025-10-21 (founding, opening, the Series A and five-site plan); Retail Insider, 2026-06-18 (the relaunched flagship); City of Toronto DineSafe dataset as updated 2026-10-01 (passes of 2025-09-12 and 2026-09-03).
  12. Smoodi: SEC EDGAR, smoodi, Inc., CIK 1956086, Form D filed 2022-12-02 (US$4,974,505 sold); TechCrunch, 2022-12-02 (the Series A, Dot Foods); getsmoodi.com, June 2026 (lease and purchase prices, locations).

Appendix C

Method note

The studio keeps three standing commitments.

Kill criteria before capital. Every format under study carries numbered, numeric, dated criteria with the exit action written in advance. This study’s K2 was falsified by research before a purchase order existed.

Falsifiable gates, amended by their misses. The amendment this study earned: read the category’s own record, and price what it costs to prove a model, before building the model. The evidence that closed this program was public and free the whole time, and it was written by operators carrying more capital than this studio will commit.

A model that cannot pay back at any demand anyone has measured is not rescued by a better site, a better machine, or a better menu, so the category record and the total-capital arithmetic now run first: before format work, before machines, before any site. Site constraints, circulation among them, are checked inside the site review where they belong.

The operating model. The studio runs as two AI surfaces around one founder: one authors strategy and task specifications, the other executes against the real system and writes back evidence. Every task ends in a written report; the reports are the record. Load-bearing claims are verified against primary sources before they are trusted, and the confirmed, refuted, and excluded counts are kept.

Appendix D

The category record

Every company this study leaned on, in one place: what each built, what it raised, and where it stood in October 2026.

Facts below follow the study’s sourcing rule. Capital figures are amounts documented in SEC filings, and none is an estimate. Each fate is dated in its entry. The record was checked again in October 2026, after the program closed. Artly was added then. Cafe X, which the July record had out of retail, is shown operating, since it reopened at San Francisco’s airport in 2021. Briggo’s capital, a press figure of US$19 million in July, is now the US$26.0 million total of its filings. None of these changes the verdict. Each company is shown with a photograph of what it built, credited under it and again in the picture credits at the back.

Where the category was tried: twelve companies in eight metropolitan areas.
CANADAUNITED STATESPACIFIC OCEANATLANTIC OCEANBay AreaCafe Xf’real FoodsBlendidLos AngelesBobacinoSeattleArtlyRichmond, BCTea IndustriesAustinBriggoChicagoZenblenTorontoteaBOTRC CoffeeCaffeoBostonSmoodiOperatingGoing-concern doubtAcquiredClosed
Figure D.1Every operator in the record, by home city and status in October 2026. The San Francisco Bay Area holds three; Toronto, the nearest of them to the study site, holds three more.Home cities and fates as in the entries below. Base map: Natural Earth, public domain. Drawn for this study.
Thirty years of the category, company by company.
1995200020052010201520202025COMPANYHOMEOCTOBER 2026f’real FoodsEmeryville, CAunder Rich Productsacquired 2012BriggoAustinunder Costa Coffeeacquired 2020teaBOTTorontoactiveCafe XSan FranciscoactiveBlendidSunnyvale, CAgoing-concern doubtZenblenChicagoactiveSmoodiBostonactiveBobacinoLos AngelesclosedArtlySeattlegoing-concern doubtRC CoffeeTorontoactiveCaffeoTorontoactiveTea IndustriesRichmond, BCclosed 2025
Figure D.2Each line runs from founding, or first unit, to the company’s fate as recorded in its entry, or to October 2026 for a company still operating. A dotted line is life under an acquirer. The durable outcomes are machine sales, venue placements on service fees, and machines simpler than a robot. No operator has published a street-facing unattended fresh-drink store that carries itself on cup margins (chapters 03 and 07).The entries below; dates as documented there.

Closed

Bobacinoclosed
Trade-show visitors with lanyards watch a white robot arm inside Bobacino’s curved glass bar, gold taps at right
Figure D.3Bobacino’s arm at work for a trade-show audience, World Tea Conference + Expo, Las Vegas Convention Center, March 22, 2022.Photo: K.M. Cannon, Las Vegas Review-Journal.
Home
Los Angeles
Founded
2020
Capital
about US$3.5M crowdfunded (SEC Regulation A+, 2021 and 2022)

Bobacino was incorporated in March 2020 inside Wavemaker Labs, a robotics venture studio, and unveiled a robotic boba bar prototype that November. It raised about US$3.5 million from crowd investors and never advanced past prototypes and trade-show demos. Its chief executive resigned in November 2023, and by January 2024 it was reported shut down along with others of the studio’s companies.

Tea Industriesclosed 2025
Inside Tea Industries: a white robot arm in a glass cabinet with two numbered pickup doors at left, a blue ordering counter and two staff at right
Figure D.4Tea Industries at its soft opening on No. 3 Road, Richmond, BC, March 2024: the robot’s glass cabinet at left, the ordering counter at right.Photo: Valerie Leung, Richmond News.
Home
Richmond, BC
Opened
March 2024
Capital
not disclosed

Tea Industries was British Columbia’s first robot bubble-tea shop. A robotic arm behind glass brewed, shook, and sealed each order in about two minutes, with staff still on hand to prepare ingredients, help customers, and clear faults. It opened in March 2024. By December 2025 its windows were papered over and the unit was up for lease (Figure 5.5). Local press reported the closure without a post-mortem, and no public account of why has been found. It was the Canadian precedent closest to this study’s format.

Acquired

Briggoacquired 2020
A wood-slatted Briggo Coffee Haus kiosk set into an airport wall, a window onto the machine at left, a pickup cubby in the middle and order screens
Figure D.5A Briggo Coffee Haus set into the wall at Austin-Bergstrom International Airport, October 2019: the machine behind the window at left, the pickup cubby in the middle.Photo: LunchboxLarry, CC BY 2.0, via Flickr.
Home
Austin
Founded
2008
Capital
US$26.0M in stock and notes reported sold (SEC Form D, 2012–2019)

Briggo raised hundreds of times the capital this program would ever commit. Founded by a semiconductor engineer, it placed its Coffee Haus kiosks with employers, grocers, and airports across a decade of raises. Costa Coffee, a Coca-Cola subsidiary, acquired it in 2020 on undisclosed terms and rebranded its five active kiosks as Costa Coffee BaristaBots.

f’real Foodsacquired 2012
An f’real blending bar in a store: a blender unit with a screen at left and a lit glass-door freezer of f’real cups at right
Figure D.6An f’real blending bar in a truck-stop store in Ontario, December 2014: the in-cup blender at left and the freezer of cups at right, where milkshakes are priced at $3.29.Photo: Cory Doctorow, CC BY-SA 2.0, via Flickr.
Home
Emeryville, CA
Founded
1995
Capital
not disclosed

The category’s one durable success is f’real, and it is not a robot. Its self-serve in-cup blender for real-milk shakes was first installed in a store in Tulsa in 2003 and was in more than 9,000 locations by December 2012, when Rich Products acquired the company. Its live patents on in-cup blending run to 2037 (chapter 03). It enforces its patents. In 2019 a Delaware jury found that Hamilton Beach and Hershey Creamery had infringed three earlier ones, and the verdict was affirmed on appeal in 2021.

Under going-concern doubt

Blendid6d bytes inc.going-concern doubt
The Blendid kiosk: a curved cream counter under a glass canopy, menu screens either side, ingredient dispensers and a robot arm behind glass
Figure D.7Blendid’s first San Francisco kiosk, in the Market Cafe of the University of San Francisco, on its test run, March 22, 2019. The menu screen prices its Strawberry and Cream smoothie at $6.Photo: Paul Chinn, San Francisco Chronicle.
Home
Sunnyvale, CA
Founded
2015
Capital
about US$36.0M paid in by April 2026 (SEC Form 1-SA), raised in part by Regulation CF and A+ crowdfunding

Blendid built an eight-by-eight-foot robot-arm smoothie kiosk, launched in 2019 and piloted at Walmart and on campuses, with a claimed pipeline of hundreds of kiosks that did not materialize. Its FY2025 annual report discloses substantial doubt about continuing as a going concern if revenue targets are not met, thirteen employees, and a US$308,000 obsolete-inventory write-off. Its July 2026 semiannual report adds a failure to raise capital as a second condition of that doubt. It stopped selling the original kiosk at the end of 2024 for two new products, a smaller, cheaper kiosk and a back-of-house unit, to be sold rather than leased.

ArtlyBlue Hill Tech, Inc.going-concern doubt
A grey robot arm behind a glass screen on a butcher-block counter, an espresso machine at left and a grinder at right, paper cups at the counter’s edge
Figure D.8Artly’s arm behind glass at the coffee bar in MUJI at the Atrium on Bay, Toronto, August 2025, between the espresso machine and the grinder.Photo: Marvin Job, TO Cityscapes.
Home
Seattle
Founded
2020
Capital
US$10.3M documented (SEC Form D, 2022; Regulation CF, 2023–24 and 2026)

Artly’s robot arm was trained by imitating human baristas. Most Artly Coffee locations are company-operated, and its robots also serve enterprise customers and host stores, MUJI among them in Vancouver and Toronto from 2024. Its June 2026 offering statement reports FY2025 revenue of US$2.2 million, a net loss of US$2.8 million, more than forty robots deployed in the United States, and an auditor’s going-concern paragraph. The same statement calls the robot closer to a premium vending solution than a coffee shop. The Toronto counter held a Google rating of 3.7 of 5, from 12 ratings, in October 2026. Its reviews describe slow drinks and staff stepping in to refill the robot.

Operating

Zenblenactive
A wood-grain Zenblen kiosk with a lit sign, a touchscreen, a card reader and a lit pickup window, a white side table beside it
Figure D.9A Zenblen kiosk on the University of Chicago campus, April 2025: touchscreen, card reader and pickup window in one wood-grain cabinet.Photo: Institute of Design, Illinois Institute of Technology.
Home
Chicago
Founded
2018
Capital
US$4.6M documented (SEC Form D, 2023 and 2026)

Zenblen is the category’s best-documented operator and the subject of this study’s chapter 03. It had eleven kiosks at audit, every one inside an access-controlled or hours-limited building and none street-facing, placed through foodservice procurement on venue-fee-plus-retail economics. One unit’s 2,500 smoothies in calendar 2023 is the only measured per-unit throughput figure the category has published.

teaBOTactive
A teaBOT kiosk: a clear cone and funnel over a hot-water spout and a lit cup platform, an order screen at right, the lit teaBOT logo below
Figure D.10A teaBOT kiosk at Northeastern University, Boston, November 2019: the clear cone under the tea canisters, the hot-water spout, a custom blend at $2.99 on the screen.Photo: Martin Lewison, CC BY 2.0, via Flickr.
Home
Toronto
Founded
2013
Capital
Y Combinator S15; venture amounts undisclosed

teaBOT’s robotic kiosk blends custom loose-leaf tea in under thirty seconds. By 2016 the company had placed kiosks in cafés, libraries, and campuses. It survived its decade by moving from revenue-share kiosks in cafés and libraries into offices, where it places and services the machine for a flat monthly fee. Its chief executive also lists himself as Zenblen’s CTO (chapter 03), one sign of how small the category’s talent pool is.

Cafe Xactive
A white industrial robot arm between two espresso machines and two towers of cups, behind curved glass
Figure D.11Cafe X’s first robot bar, inside the Metreon, San Francisco, March 2018: the arm between two espresso machines, the cup towers behind it.Photo: Ed Johnson, CC0, via Flickr.
Home
San Francisco
Founded
2014
Capital
US$9.7M documented (SEC Form D, 2018; Regulation CF, 2023)

Cafe X put an industrial robot arm behind glass in downtown San Francisco in January 2017 and closed all three city locations in January 2020. Crunchbase News reported that its founder wanted it to be less robot, more old-school coffee. The pandemic closed its airport bars within months, and it reopened at San Francisco’s airport in 2021. In 2026 it runs three bars there and sells its machines to other operators, with placements listed from Dubai to Berlin.

RC Coffeeactive
A free-standing white RC Coffee Robo Cafe kiosk with blue leaf drawings and a neon coffee sign, order screens in its window, in a hospital food court
Figure D.12RC Coffee’s Robo Cafe kiosk in the food court of Toronto General Hospital, July 2022: order screens and the pickup hatch in the window.Photo: handout, via Global News.
Home
Toronto
First kiosk
2020
Capital
not disclosed; a unit of KioSoft Technologies, an unattended-payments company

RC Coffee runs Toronto’s unattended espresso network. Its first kiosk opened in fall 2020 with a local roaster, and its own Robo Cafe brand followed in June 2021. It listed twelve or more locations in July 2026 and ten in October 2026, hospital sites among them. Its kiosks are cashless and use fresh dairy. DineSafe holds no record of them in any year of operation, which is half of chapter 04’s enforcement finding.

Caffeoactive
A red and white robot arm setting a lidded iced latte down on a dark counter
Figure D.13Caffeo’s arm setting down an iced latte inside the Richmond Street West store, 2025.Photo: Caffeo, via 6ix Retail.
Home
Toronto
Founded
2023
Capital
not disclosed

Caffeo’s robot arm works espresso equipment behind glass on Richmond Street West, where the store opened in September 2025. It is the other half of chapter 04’s finding. It passed a DineSafe Food Premises inspection on 2025-09-12, in its first weeks of trading, and another on 2026-09-03. A Series A it targeted for the end of 2025 has not been announced, and one of the five sites it planned for the end of 2026 is open. The flagship relaunched in June 2026 and keeps operating.

Smoodiactive
A Smoodi self-serve blending kiosk on a stainless counter, a glass-front freezer of fruit cups beside it and a screen above
Figure D.14A Smoodi self-serve blending station, pre-portioned frozen fruit cups in the glass-front freezer beside the blender, February 2026.Photo: יאיראבני, CC BY-SA 4.0, via Wikimedia Commons.
Home
Boston
Founded
2018
Capital
US$4.97M Series A (SEC Form D, 2022)

Smoodi tests the cheaper thesis. It has no robot arm, only a self-cleaning blender over a freezer of pre-portioned frozen fruit cups, leased from US$299 a month or bought from US$14,999. It closed a Series A in December 2022, has national foodservice distribution, and claimed 300-plus locations by 2026. Its machine is the US$14,999 rung in Figure 5.1.

Picture credits

Every photograph, map and reproduced drawing in this study, in the order it appears. Photographs under a free licence are credited by title, author, source and licence, and are used on that licence’s terms; changes are noted. Press photographs are reproduced at review scale for the purpose of review. The study’s own pictures carry no third-party rights.

  1. CoverThe study site from the north-east, April 2025. Craftpine (owner-side site archive). Own work. Aerial photography of the site, April 2025; colour-graded, resized, metadata stripped.
  2. Chapter 01No. 520 from the north, April 2025. Craftpine (owner-side site archive). Own work. Aerial photography of the site, April 2025; colour-graded, resized, metadata stripped.
  3. Figure 1.1A Hamilton Street Railway bus at Eastgate Square, Stoney Creek. “NovaBus LFS CNG Hamilton Street Railway (HSR) unit 2283”, BrackishStowaway. CC BY 4.0, commons.wikimedia.org/wiki/File:NovaBus_LFS_CNG_Hamilton_Street_Railway_(HSR)_unit_2283.jpg. Resized.
  4. Figure 1.2The site on the QEW at the west end of Lake Ontario. Natural Earth. Public domain, naturalearthdata.com/. Lakes, rivers, roads and the international boundary at 1:10 million, redrawn.
  5. Figure 1.4Barton eastbound toward the Dewitt junction. Craftpine (owner-side site archive). Own work. Aerial photography of the site, April 2025; the prior tenant’s pylon sign, which carried telephone numbers, retouched blank; colour-graded, resized, metadata stripped.
  6. Figure 1.5The corner from the north-east. Craftpine (owner-side site archive). Own work. Aerial photography of the site, April 2025; colour-graded, resized, metadata stripped.
  7. Figure 1.6The junction looking south along Dewitt Road. Craftpine (owner-side site archive). Own work. Aerial photography of the site, April 2025; colour-graded, resized, metadata stripped.
  8. Figure 1.7The junction and its neighbourhood. OpenStreetMap contributors. ODbL 1.0, openstreetmap.org/copyright. Roads, schools, land use and building footprints extracted October 2026 and redrawn.
  9. Chapter 02A convenience store in Swansea, Toronto. “Sunshine Foods Convenience store, Toronto 2026”, Chicken4War. CC BY-SA 4.0, commons.wikimedia.org/wiki/File:Sunshine_Foods_Convenience_store,_Toronto_2026.jpg. Cropped and resized.
  10. Figure 2.2Tapioca pearls in bubble tea; frozen berries. “A bubble tea with tapioca pearls, July 2018”, sam651030 (Pixabay). CC0, commons.wikimedia.org/wiki/File:A_bubble_tea_with_tapioca_pearls,_July_2018.jpg. Cropped and resized. “Frozen berries”, I saw_that (Flickr). Public domain, commons.wikimedia.org/wiki/File:Frozen_berries_(35379207760).jpg. Cropped and resized.
  11. Figure 2.3Beverage vending machines in Wadabori Park, Tokyo. “Beverage vending machines in Wadabori Park in Omiya, Suginami, Tokyo, Japan, 2024 May”, Ximonic (Simo Räsänen). CC BY-SA 4.0, commons.wikimedia.org/wiki/File:Beverage_vending_machines_in_Wadabori_Park_in_Omiya,_Suginami,_Tokyo,_Japan,_2024_May.jpg. Cropped and resized.
  12. Figure 2.4Żabka Nano stores in Katowice and Warsaw. “Żabka Nano storefront in Katowice, Poland”, Jonathan Deamer. CC BY 4.0, commons.wikimedia.org/wiki/File:%C5%BBabka_Nano_storefront_in_Katowice,_Poland.png. Resized. “2025 Warszawa Dworzec Gdański, Żabka Nano, 2”, Cybularny. CC0, commons.wikimedia.org/wiki/File:2025_Warszawa_Dworzec_Gda%C5%84ski,_%C5%BBabka_Nano,_2.jpg. Resized.
  13. Chapter 03Chicago from the 16th Street bridge. “Chicago skyline from 16th Street bridge”, John Picken. CC BY 2.0, commons.wikimedia.org/wiki/File:Chicago_skyline_from_16th_Street_bridge.jpg. Cropped and resized.
  14. Figure 3.2A Zenblen kiosk in a Chicago building lobby. Polsky Center for Entrepreneurship and Innovation, University of Chicago. Press photograph, review scale, polsky.uchicago.edu/2025/06/11/zenblens-smooth-rise-from-office-blender-to-robotic-smoothie-bar/.
  15. Figure 3.4Drawings from US 9,579,615 B2. “Blender with elevator assembly and removable spindle, US 9,579,615 B2 (February 28, 2017)”, United States Patent and Trademark Office (patentee: f’real Foods, LLC). Public record, image-ppubs.uspto.gov/dirsearch-public/print/downloadPdf/9579615. Sheet headers removed; four drawings set side by side at one height.
  16. Figure 3.5The Jamba by Blendid kiosk in a Walmart, Dixon, California. Blendid (6d bytes inc.), via The Spoon. Press photograph, review scale, thespoon.tech/exclusive-blendid-and-jamba-co-brand-new-smoothie-robot/.
  17. Chapter 04The Ontario Legislative Building, Queen’s Park. “Queen’s Park, Toronto, 2010 (cropped-rotated)”, Benson Kua. CC BY-SA 2.0, commons.wikimedia.org/wiki/File:Queen%27s_Park_-_Toronto_-_2010_(cropped-rotated).jpg. Cropped and resized.
  18. Figure 4.2Toronto City Hall and Nathan Phillips Square. “Toronto, ON: Rathaus und Nathan Phillips Square”, Taxiarchos228. CC BY 3.0, commons.wikimedia.org/wiki/File:Toronto_-_ON_-_Rathaus_und_Nathan_Phillips_Square.jpg. Resized.
  19. Figure 4.4RC Coffee’s Robo Cafe; Caffeo on Richmond Street West. RC Coffee / TechTrex, via Newsfile. Press photograph, review scale, newsfilecorp.com/release/90623/RC-Coffee-Launches-Robo-Cafe-in-Canada-Bringing-Robot-Baristas-to-Torontos-Trendiest-Neighbourhoods. Cropped to 4:3. Dustin Fuhs, 6ix Retail. Press photograph, review scale, 6ixretail.com/2025/10/caffeo-precision-robotic-coffee-toronto-fashion-district/.
  20. Figure 4.5Chicago City Hall, LaSalle Street. “Chicago City Hall”, ajay_suresh. CC BY 2.0, commons.wikimedia.org/wiki/File:Chicago_City_Hall_(51575574600).jpg. Resized.
  21. Chapter 05The Centerm container terminal, Port of Vancouver. “Vancouver (BC, Canada), Vancouver Centerm Terminal, 2022”, Dietmar Rabich. CC BY-SA 4.0, commons.wikimedia.org/wiki/File:Vancouver_(BC,_Canada),_Vancouver_Centerm_Terminal_--_2022_--_2151.jpg. Cropped and resized.
  22. Figure 5.3A vending machine at Xietang Station, Suzhou; a retrofitted card reader. “Coca-Cola vending machine at Xietang Station, 2023-05-20”, Shwangtianyuan. CC BY-SA 4.0, commons.wikimedia.org/wiki/File:Coca-Cola_vending_machine_at_Xietang_Station-20230520.jpg. Cropped and resized. “Vending Machine Credit Card Reader, Currenza”, Tony Webster. CC BY 2.0, commons.wikimedia.org/wiki/File:Vending_Machine_Credit_Card_Reader_-_Currenza_(40144498123).jpg. Resized.
  23. Figure 5.5Bobacino’s demonstration bar, Las Vegas; the closed Tea Industries storefront, Richmond, BC. Aaron Kiel, for World Tea News. Press photograph, review scale, worldteanews.com/whats-brewing/fomo-heres-what-you-missed-world-tea-expo-2022-photo-essay. Cropped to the machine; the exhibitors beside it are cut out. Marco Ovies, Dished (Daily Hive). Press photograph, review scale, dailyhive.com/vancouver/tea-industries-richmond. On the lease signs, a realtor’s name, telephone number and e-mail address, a brokerage telephone number, and the poster’s contact lines and QR code retouched blank; resized.
  24. Figure 5.6Cafe X’s robot-arm coffee bar. Cafe X Technologies, via The Spoon. Press photograph, review scale, thespoon.tech/cafe-x-shuts-down-its-three-downtown-san-francisco-locations/.
  25. Chapter 06The bench unit, July 2026. Craftpine. Own work. The kiosk software’s wordmark is retouched out of the screen.
  26. Figure 6.3The bench unit, three views. Craftpine. Own work. The kiosk software’s wordmark is retouched out of the screens; the on-screen QR, staged for the shoot, leads to this study.
  27. Figure 6.4The phone checkout and the July 9 charge. Craftpine. Own work. Cropped to the one transaction; no personal data.
  28. Figure 6.5The edge computer on the bench. Craftpine. Own work.
  29. Chapter 07Juices and smoothies at the Mercat de la Boqueria, Barcelona. “Barcelona (3391243387)”, Bert Kaufmann from Roermond, Netherlands. CC BY 2.0, commons.wikimedia.org/wiki/File:Barcelona_(3391243387).jpg. Cropped and resized.
  30. Chapter 08The lot from above, April 2025. Craftpine (owner-side site archive). Own work. Aerial photography of the site, April 2025; the prior tenant’s pylon sign, which carried telephone numbers, retouched blank; colour-graded, resized, metadata stripped.
  31. Figure 8.2The vehicle plane at ground level. Craftpine (owner-side site archive). Own work. Ground photography of the site, December 2024 to April 2025; resized, metadata stripped.
  32. Figure 8.3The lot from the north-east. Craftpine (owner-side site archive). Own work. Aerial photography of the site, April 2025; the prior tenant’s pylon sign, which carried telephone numbers, retouched blank; colour-graded, resized, metadata stripped.
  33. Figure 8.4Two faces of the building. Craftpine (owner-side site archive). Own work. Ground photography of the site, December 2024 to April 2025; resized, metadata stripped.
  34. Figure 8.5The rear structure. Craftpine (owner-side site archive). Own work. Ground photography of the site, December 2024 to April 2025; resized, metadata stripped.
  35. Chapter 09The corner and its neighbourhood, April 2025. Craftpine (owner-side site archive). Own work. Aerial photography of the site, April 2025; the prior tenant’s pylon sign, which carried telephone numbers, retouched blank; colour-graded, resized, metadata stripped.
  36. Figure 9.1The corner, looking west along Barton Street East. Craftpine (owner-side site archive). Own work. Aerial photography of the site, April 2025; colour-graded, resized, metadata stripped.
  37. Figure D.1The category’s operators by home city. Natural Earth. Public domain, naturalearthdata.com/. Land, lakes and boundaries at 1:50 million, redrawn in an Albers equal-area projection.
  38. Figure D.3Bobacino’s arm at the World Tea Conference + Expo, Las Vegas. K.M. Cannon, Las Vegas Review-Journal. Press photograph, review scale, reviewjournal.com/business/conventions/world-tea-expo-offers-a-different-flavor-in-las-vegas-2549804/. Cropped to 4:3.
  39. Figure D.4Tea Industries at its soft opening, Richmond, BC. Valerie Leung, Richmond News. Press photograph, review scale, richmond-news.com/local-business/bcs-first-robot-bubble-tea-shop-soft-opens-in-richmond-8511827. Cropped to 4:3 and resized.
  40. Figure D.5A Briggo Coffee Haus at Austin-Bergstrom International Airport. “IMG_20191029_040541”, LunchboxLarry (Flickr). CC BY 2.0, flickr.com/photos/squirrel02/48979141078/. Cropped to 4:3 and resized.
  41. Figure D.6An f’real blending bar in a truck-stop store, Ontario. “Coin-op milkshake robot, truck-stop, Ontario, Canada”, Cory Doctorow. CC BY-SA 2.0, flickr.com/photos/doctorow/16113241132/. Resized.
  42. Figure D.7Blendid’s first San Francisco kiosk, University of San Francisco. Paul Chinn, The San Francisco Chronicle. Press photograph, review scale, sfchronicle.com/food/article/Meet-San-Francisco-s-new-giant-13710040.php. Cropped to 4:3 and resized.
  43. Figure D.8Artly’s coffee bar in MUJI at the Atrium on Bay, Toronto. Marvin Job, TO Cityscapes. Press photograph, review scale, tocityscapes.com/jarvis-the-robot-barista/. Cropped to 4:3.
  44. Figure D.9A Zenblen kiosk on the University of Chicago campus. Institute of Design, Illinois Institute of Technology. Press photograph, review scale, id.iit.edu/story/id-designed-zenblen-smoothie-kiosks-expand-across-chicago/zenblen-uofc1/. Cropped to 4:3, resized, location metadata stripped.
  45. Figure D.10A teaBOT kiosk at Northeastern University, Boston. “teaBOT at Northeaster University”, Martin Lewison. CC BY 2.0, flickr.com/photos/milst1/49557048233/. Cropped to 4:3 and resized.
  46. Figure D.11Cafe X’s first robot bar, the Metreon, San Francisco. “Coffeebot 3000”, Ed Johnson. CC0, flickr.com/photos/edwardotis/25842108757/. Cropped to 4:3 and resized.
  47. Figure D.12RC Coffee’s Robo Cafe at Toronto General Hospital. Handout (as printed by Global News). Press photograph, review scale, globalnews.ca/news/9039689/automated-work-coffee-barista-future-jobs/. Cropped to 4:3 and resized.
  48. Figure D.13Caffeo’s arm with an iced latte, Richmond Street West. Caffeo, via 6ix Retail. Press photograph, review scale, 6ixretail.com/2025/10/caffeo-precision-robotic-coffee-toronto-fashion-district/. Cropped to 4:3.
  49. Figure D.14A Smoodi self-serve blending station. “Smoodi”, יאיראבני (Wikimedia Commons user). CC BY-SA 4.0, commons.wikimedia.org/wiki/File:Smoodi.jpg. Re-encoded; not otherwise changed.

Back to the short version, or on to Corner, the program the study belonged to.